Surfer®
A Powerful Contouring, Gridding, and Surface Mapping Package for Scientists and Engineers
Price: $599
($139 upgrade)
Version: 7
· Media: 1 CD-ROM
Operating Systems: Win95/98, Windows NT 4.0, or higher
Surfer®
A Powerful Contouring, Gridding, and Surface Mapping Package for Scientists and Engineers Price: $599 ($139 upgrade) Version: 7
· Media: 1 CD-ROM
Which Surfer Features Would You Like to Learn About? |
Surfer is a contouring and 3D surface plotting program that runs under Microsoft Windows and has extensive variogram modeling capabilities. Surfer quickly and easily converts your data into outstanding contour, wireframe, vector, image, shaded relief, and post maps. Virtually all aspects of your maps can be customized to produce exactly the presentation you want. Producing publication quality maps has never been quicker or easier.
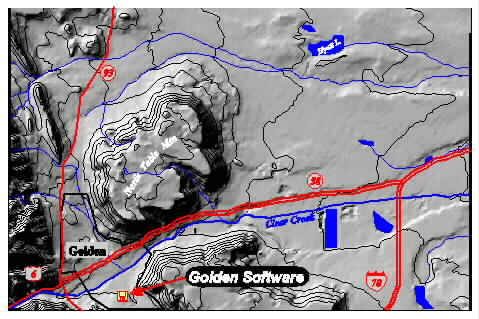
Click on either graphic to see an enlarged version! The same graphic is displayed with two different color schemes. It is easy to customize your presentations in Surfer by changing map attributes and by overlaying several maps. Contour MapsSurfer contour maps give you full control over all map parameters. You can accept the Surfer intelligent defaults to automatically create a contour map, or double-click a map to easily customize map features. Display contour maps over any contour range and contour interval, or specify only the contour levels you want to display on the map. And with Surfer you can add color fill between contours to produce dazzling displays of your maps, or produce gray scale fills for dramatic black and white printouts.
A USGS DEM of the Morrison, CO Quadrangle was used to create the above contour map. The right half is an enlarged portion of the DEM. Contour Map Features
3D Wireframe Maps Surfer wireframe maps provide an impressive three dimensional display of your data. Use color zones, independent X,Y,Z scaling, orthographic or perspective projections at any tilt or rotation angle, and different combinations of X, Y and Z lines to produce exactly the surface you want. Drape a color-filled contour map over a wireframe map to create the most striking color or black-and-white representations of your data. The possibilities are endless.
A wireframe map can be used to display any combination of X,Y, and Z lines. A USGS SDTS DEM file was used to create this map and color zones were defined for the X and Y lines. 3D Wireframe Map Features
Vector Maps Instantly create vector maps in Surfer. A vector map shows direction and magnitude of data at points on a map. You can create vector maps from information in one grid or two separated grids. The two components of the vector map, direction and magnitude, are automatically generated from a single grid by computing the gradient of the represented surface. At any given grid node, the direction of the arrow points in the direction of the steepest descent. The direction of the arrow changes from grid node to grid node depending on the information surrounding the grid node. The magnitude of the arrow changes depending on the steepness of the descent. Two-grid vector maps use two separate grid files to determine the vector direction and magnitude. The grids can contain Cartesian or polar data. With Cartesian data, one grid consists of X component data and the other grid consists of Y component data. With polar data, one grid consists of angle information and the other grid contains length information. Overlay vector maps on contour or wireframe maps to enhance the presentation!
A vector map of Mt. St. Helens overlaid on a contour map. Use a color scale bar or legend to indicate the magnitude of the arrows.
A vector map of Jay Peak, Vt. overlaid on a wireframe map. Vector Map Features
Image Maps Surfer image maps use different colors to represent elevations of a grid file. Create image maps using any grid-type file: GRD, DEM, DDF, HDR. Surfer automatically blends colors between percentage values so you end up with a smooth color gradation over the map. You can add color anchors at any percentage point between 0 and 100. Each anchor point can be assigned a unique color, and the colors are automatically blended between adjacent anchor points. This allows you to create color maps using any combination of colors. Any color fill you choose for an image map can be used with any other image map, even if the associated grid files cover distinctly different Z ranges. Image maps can be created independently of other maps, or can be combined with other maps. They can be scaled, resized, limited and moved. ...... Add color to your image map to customize it. Image Map Features
Shaded Relief Maps Surfer Shaded Relief maps create a shaded relief map from a grid [.GRD] file or USGS DEM file. These maps use different colors to indicate surface slope and slope direction relative to a user-defined light source direction. Surfer determines the orientation of each grid cell on the surface, and assigns a unique color to each grid cell. Colors on shaded relief maps are associated with light striking the surface. The light source can be thought of as the sun shining on a topographic surface. Surfer automatically blends colors between percentage values so you end up with a smooth color gradation over the map. You can add color anchors so each anchor point can be assigned a unique color, and the colors are automatically blended between adjacent anchor points. This allows you to create color maps using any combination of colors. Shaded relief maps can be created independently of other maps, or can be combined with other maps in map overlays (using the Overlay Maps command). Shaded Relief maps can be scaled, resized, limited, and moved in the same way as other types of maps.
Adjust the light source angle when creating shaded relief maps. Shaded Relief Map Features
Post Maps Post maps show X,Y locations with fixed size or proportionally scaled symbols of any color. Create post maps independent of other maps on the page, or overlay the posted points on a base, contour, vector, or surface map. For each posted point, specify the symbol and label type, size, and angle. Also create classed post maps that identify different ranges of data by automatically assigning a different symbol to each data range. Post your original data point locations on a contour map to show the distribution of data points on the map, and to demonstrate the accuracy of the gridding methods you use.
Use post maps to display the location of your XY data.
Post Map Features
Base Maps Surfer can import maps in many different formats to display geographic information. You can combine base maps with other maps in map overlays, or can create stand-alone base maps independent of other maps on the page. You can load any number of base maps on a page. Base maps can be imported from DXF, BLN, WMF, TIF, PCX, LGO, BMP, BNA, GSB, PLT, CLP, TGA, PCX, DLG, LGS, SHP, MIF, JPG, PNG, DCX, WPG, PCT, USGS SDTS DDF, and other formats. It is easy to overlay a base map on a contour or surface wireframe map, allowing you to display geographic information in combination with the three dimensional data.
Display your base maps in Surfer alone or overlay them on other maps. Base Map Features
Map Overlays Map overlays give you a way to combine any number of contour, wireframe, vector, base, and post maps. Draping a filled contour map over a wireframe map produces the most striking display of 3D data possible. And because you can overlay any number of maps, you can show any amount of data on a single map.
This map was created by overlaying two contour maps, a basemap, and a wireframe map in order to display contaminate spread. Gridding The gridding methods in Surfer allow you to produce accurate contour, wireframe, vector, image, and shaded relief maps from your XYZ data. The data can be randomly dispersed over the map area, and Surfer's gridding will interpolate your data onto a grid. You have several gridding methods to choose from, so you can produce exactly the map you want. And with each gridding method you have complete control over the gridding parameters. Or if your data is already collected in a regular rectangular array, you can create a map directly from your data. Computer generated contour maps have never been more accurate. . Gridding Features
Variograms Use the variogram modeling subsystem to quantitatively assess the spatial continuity of data. Variograms may be used to select an appropriate variogram model when gridding with the Kriging algorithm. Surfer uses a variogram grid as a fundamental internal data representation and once this grid is built, any experimental variogram can be computed instantaneously. . Instantly create variograms in Surfer to quantitatively assess the spatial continuity of your data. Variogram Features
Faults and Breaklines Define faults and breaklines when gridding your data. The data on one side of the fault will not be directly used to calculate grid node values on the other side of the fault. Unlike faults, breaklines are not barriers to information flow and the gridding algorithm can cross the breakline to use a point on the other side. When the gridding algorithm sees a breakline, any data points that lie directly on the breakline take precedence over an interpolated value. Use breaklines to define streamlines, ridges, and other breaks in slopes. The gridding methods that support faults and breaklines are: Inverse Distance to a Power, Kriging, Minimum Curvature, Nearest Neighbor, and Radial Basis Functions
A contour map that features a fault is displayed here. Faults and breaklines are specified when gridding your data USGS Digital Elevation Model (DEM) Files
Digitize Boundaries
Active X Automation Virtually any operation that you can perform interactively can be controlled using an ActiveX Automation-compatible programming language such as Visual Basic, C++, or Perl. Surfer includes GS Scripter - a Visual Basic-compatible programming environment that lets you write, edit, debug, and run scripts. In this way you can automate repetitive tasks, create front ends for running Surfer, or carry out any task that Surfer can do.Some of our most popular scripts are available for free to our customers. To download them from this site, click here! Worksheet Surfer includes a full-featured worksheet for creating, opening, editing, and saving data files. Data files can be up to 5 million rows. You can use the Windows Clipboard functions to Cut, Copy, and Paste data within the Surfer worksheet, or between applications Worksheet Features
Object Manager The object manager makes the editing of any object simple. It displays all the objects in the document in an easy-to-use hierarchical tree arrangement. Select objects in the object manager to easily edit them and to show or hide them
Use the object manager to easily access and edit all the objects that appear in your plot window. Additional Utilities and Features
Year 2000 compliance All Golden Software products are year 2000 compliant. Golden Software represents and warrants that Surfer, Grapher, MapViewer and Didger are designed to be used prior to, during, and after the calendar year 2000 AD. Surfer, Grapher, MapViewer and Didger will operate during each such time period without error relating to date data, specifically including any error relating to, or the product of, date data which represents or references different centuries or more than one century. System Requirements
Learn more about Golden
Software Products on this CD! Please visit the Golden Software web site
at While visiting the web site, you'll be
able to
Copyright 1997 - 2000, Golden Software, Inc. |