What's New in Surfer 7?
Double Precision
Surfer 7 is a 32-bit double precision application designed to run on Windows 95/98 or higher and NT4 or higher. Double precision allows you to display up to 15 decimal digits without losing precision.
Quicker
The speed of reading and writing binary files has been increased several fold. Surfer 7 is much faster!
New Map Type – Vector Maps
At the request of our users, we have added vector maps to Surfer 7. You have full control over symbol style, color, frequency, and scaling. Use one or two grid files to create your vector maps and Surfer 7 automatically computes the gradient of the represented surface. Overlay your vector maps on contour, wireframe, post, or base maps for spectacular results.
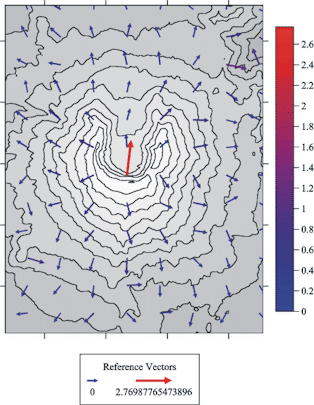
A vector map of Mt. St. Helens overlaid on a contour map. Use a color scale bar or legend to indicate the magnitude of the arrows.
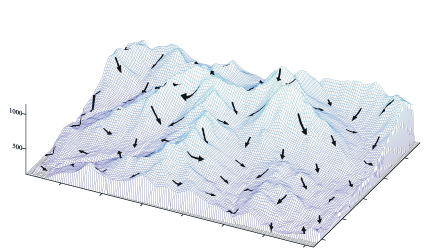
A vector map of Jay Peak, Vt. overlaid on a wireframe map.
Variograms
Instantly create variograms! Interactive modeling, sophisticated data exclusion filtering, and simultaneous report generation are just some of the new features associated with creating variograms in Surfer 7.
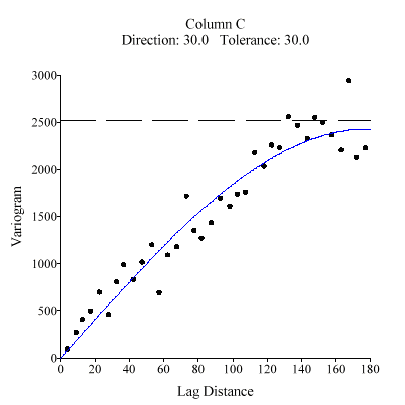
Instantly create variograms in Surfer to quantitatively assess the spatial continuity of your data.
New Gridding Features
Two Surfer 7 gridding methods have been significantly enhanced to accurately grid your data. The two enhanced methods are:
- Minimum Curvature
- Modified Shepard’s Method
In addition, we have added a new, state-of-the-art gridding method:
- Natural Neighbor
Other Added Gridding Features include:
- Powerful duplicate data resolution
- Generate a grid of Kriging standard deviations
- Specify either point or block Kriging
- Generate a report of the gridding statistics and parameters
- Customize search rules
Faults and Breaklines
Easily and quickly define faults and breaklines when gridding your data. The data on either side of the fault will not be used to calculate grid node values on the opposite side of the fault. Use breaklines to define streamlines, ridges, and other breaks in slopes
.
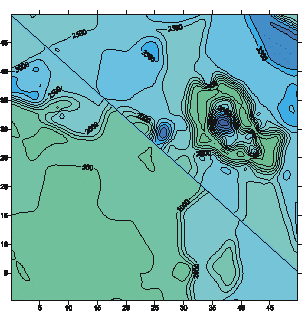
A contour map that features a fault is displayed here. Faults and breaklines are specified when gridding your data.
Automation – Complete Programming Control
Surfer 7’s powerful scripting support provides complete control through any Active X Automation controller, including Visual Basic. Surfer 7 also includes Golden Software’s Scripter, a Visual Basic compatible development environment that makes it easy to write and debug scripts. Scripts make it simple to automate your tasks and interact with other applications.
Some of our most popular scripts are available for free to our customers. To download them from this site, click here!Use USGS SDTS DEM and DLG Files in Native Format
Use USGS SDTS Digital Elevation Model files (DEM) in Surfer to make contour, wireframe, vector, shaded relief, and image maps just as you would utilize a regular GRD file. Use the SDTS DEM files in their native format; there is no need for a conversion!
Similarly, use SDTS USGS DLG files directly in Surfer 7 to define boundaries. They can be directly loaded into Surfer 7.
New 3D DXF Export
This long awaited feature has now been incorporated into Surfer 7! Export your maps as 3D DXF files; then import them into your favorite CAD program.
Other New Export Options
New export options include: SHP, PNG, BLN, and BNA file formats.
Editable Contour Labels
Add, delete, and move individual contour labels on the screen to customize your map. Simply click on a contour label and drag it to a new location.
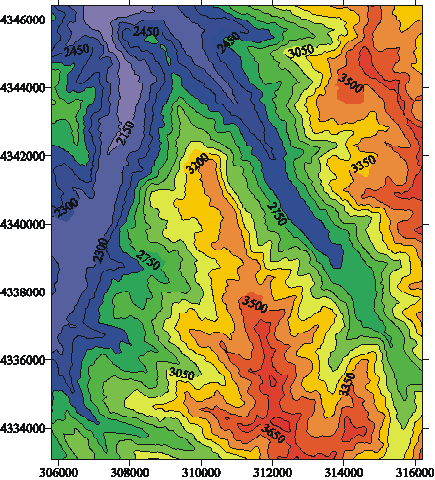
A USGS DEM file was used to create this contour map. The contour labels were positioned by hand.
Object Manager
The new object manager graphically displays all the objects contained in the plot window. This feature simplifies the editing of any object. Select any object in the object manager and click on it to open that object’s dialog box. Move an object to the foreground or background by dragging it in the object manager. Hide or show an object from the object manager. With a click of the mouse, customize axes, maps, text, symbols, or other objects using the object manager.
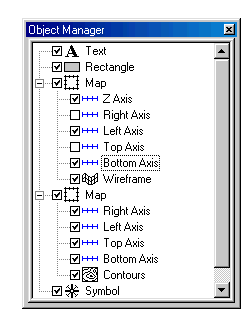 Use the object manager to easily
access and edit all the objects that appear in your plot window.
Worksheet
Use data files that are up to 5 million rows in size in the new worksheet. Other new features include the capability to print from the worksheet. Save your worksheet in any of the several file format types: XLS, CSV, TXT, BNA, BLN, SLK, and DAT. Import formats supported include: XLS, DAT, SLK, WKx, WRx, CSV, TXT, BNA, and BLN. Other new features include the capability to print from the worksheet, cell formatting, double precision, and new statistics.
New Symbols
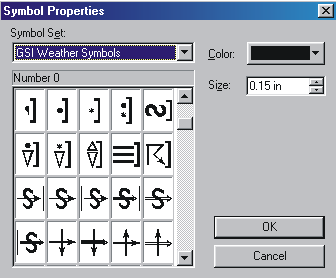
Surfer 7 uses customized True Type fonts and symbols. Included are six new sets of symbols:
- Oil and Gas Symbols
- Wind Barb Symbols
- Weather Symbols
- North Arrow Symbols
- Didger Symbols
- Map Symbols
Improved User Interface
Surfer 7 has many new features that improve the user interface. Tabbed dialog boxes make it easy to find and edit object properties. Use the Apply button to view your changes without closing the dialog box. The toolbars can be floating or docked, allowing you to position them exactly where you need them. Right click on objects to see object specific pop-up menus.
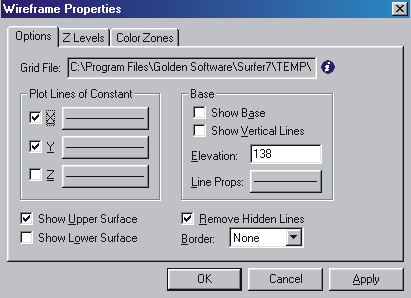
The new, tabbed, and easy-to-use dialog box format.
Learn more about Golden
Software Products on this CD!
Home * Surfer
* Grapher * MapViewer
* Didger
Please visit the Golden Software web site
at
http://www.goldensoftware.com!
While visiting the web site, you'll be
able to
buy Surfer or download a demo copy!
Copyright 1997 - 2000, Golden Software, Inc.