Grapher™
.
A Technical Graphing Package for Scientists, Engineers and Business Professionals
Price: $299
($99 upgrade)
Version: 2
Operating Systems: Win95/98, NT 4.0
Media: CD ROM
Grapher is an easy to understand technical graphing package for anyone who needs to create publication-quality graphs quickly and easily. Create Line Graphs, Symbol Graphs, Bar Charts, Function Plots, Hi-Low-Close Graphs, Polar Graphs, Pie Charts and Histograms. Create your own custom graphs and add legends, curve fits, text or drawing objects. Create templates to use the same graph settings with multiple data files. Automate the graphing process with the included Scripter™ program. Export graphs for use in presentations and publications in one of Grapher's many export formats.
Which Grapher Features Would You Like to Learn About?
| Graph Types | Worksheet Features |
| Curve Fits | Additional Features |
| Template Graphs | Automation |
| Axes | Import and Export Options |
| Error Bars | Year 2000 Compliance |
| Text Editor | System Requirements |
Display your data as seven different graph types in Grapher. Different graph types can be combined on one graph and multiple graphs can be created on one page.
- Line and Symbol Graphs display data as a line or symbols.
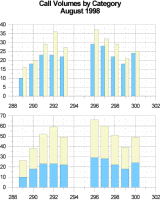
- Bar Charts display data as adjacent or stacked bars.
Create bar charts with
adjacent or stacked bars.
Specify bar width
for a customized graph.
enlarge
graphic
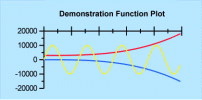
Function Plots display mathematical functions. Plot Y as a function of X, or plot a parametric equation where X and Y are a function of a third variable, T.
Specify a function or equation
to create a graph. Position the
axes anywhere on the page.
enlarge graphic
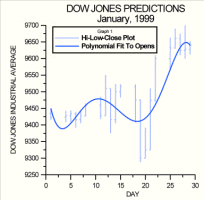
- Hi-Low-Close Graphs display a range of Y values at each X value. These plots are commonly used to display the high, low, opening and closing of stock values, though Hi-Low-Close graphs are also used for many other purposes.
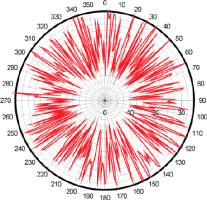
- Polar Graphs display degree, radian or
grad data versus a radial distance. The degree, radian or grad data are displayed on
a circular angle axis. The second axis is a radial axis showing the distance from
the center of the circle.
Display degree, radian, or
grad data versus radial distance
on a Polar Graph.
enlarge graphic - Pie Charts show data as proportional slices of a circle. Each data value is divided by the sum of the data to determine the size of the slice.
Track stock performance with the
High-Low-Close Graph. Overlay a
best-fit curve to predict future
performance.
enlarge graphic
- Histograms display data separated into groups or bins.
Curve fitting routines help depict trends in your data. Select pre-defined fits or define a custom fit to add to the graph. Display fits for Line and Symbol Graphs, Polar Graphs and Histograms. There are 9 pre-defined curve-fitting algorithms in Grapher:
- Linear
- Logarithmic
- Exponential
- Power
- Spline Smoothing
- Polynomial Regression
- Orthogonal Polynomial Regression
- Linear through Origin
- Running Average
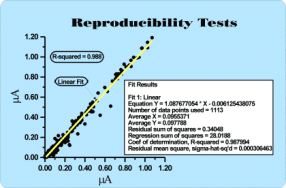
Associate any number of fits with a single curve. Change the line style, color and width for each fit. Applicable statistics are available for each fit. The resulting statistics are copied to the clipboard or displayed in a report window.
Display data using a curve fit.
Equation coefficients can also be displayed.
enlarge graphic
Create a graph with the desired colors, number formats, tick mark spacing, legend styles, etc., and save it as a template graph for use with multiple data sets.
Grapher has three axis types: linear, logarithmic, and probability. Use Grapher's default settings or specify custom settings for all axis parameters. Set the axis scale, change the axis length and starting position, add additional or duplicate axes, add axis limits, enter an axis title, add grid lines or hide the axis on your graph. On each axis, you control the major and minor tick frequency and spacing or you can use Grapher's default settings. Use automatic date and time labeling or read axis tick labels from a worksheet, allowing you to use any type of tick labeling.
Display your graph with linear,
logarithmic or probability axes.
enlarge graphic
Error Bars are displayed on Line and Symbol Graphs. Display error bars for the average value, sample standard deviation, population standard deviation, or standard error of the mean. Or, calculate custom error bars in the worksheet and display them on the graph.
Easily add text objects to graphs using Grapher's text editor. Easily select any typeface, font size and color. Add superscripts, subscripts and symbols to your text. Automatically enter current dates and times. Create complex mathematical equations and include them in your graph.

Use Grapher's text editor to create complex mathematical equations.
- Display, enter, edit, print and save data.
- Double precision capabilities allow up to 15 digits without loss of precision.
- Import data files in the following formats: XLS, SLK, WKx, WRx, CSV, TXT, DAT, BNA, and BLN.
- Save your data files in XLS, SLK, CSV, TXT, DAT, and BNA formats.
- Cell formatting includes background colors.
- Control cell height and width.
- Include formatting information when copying to the worksheet.
- Sort data using multiple columns.
- Calculate numerous statistical functions on individual columns of data.
- The number of data points the worksheet can handle is only limited by the amount of memory available on your computer (up to 5,000,000 rows x 5,000,000 columns).
- Set multiple levels of undo (up to 25).
- Add legends to graphs.
- Add color fill under curves.
- Customize Grapher by selecting the default settings.
- Control line styles, color and width.
- Change font type, size, color and style.
- Draw points, lines, polygons, rectangles and ellipses.
- Create custom colors.
- Reshape polylines using the reshape tool.
- Combine and break apart composite objects.
- Rotate objects.
- View and edit all objects using the Object Manager.
- Use the Arrange command to move objects forwards or backwards.
- Create your own custom dashed line styles.
- Add a variety of arrows to the ends of polylines.
- Digitize data from a graph and write the data to a file.
- Display and edit detailed areas of a graph using the Zoom commands.
- Make changes to data in the worksheet and have the graph update with the new data automatically.
- Automate Grapher from any Active X Automation compatible client such as Visual BASIC or use Golden Software's Scripter.
- Embed and link Grapher into other applications.
- Embed and link documents from other applications into Grapher.
Fill the area under the curve
with a solid color or pattern.
enlarge graphic
- Import formats include: GSB, BNA, DLG, LGO, LGS, DXF, PLT, BLN, CLP, WMF, TIF, BMP, TGA, PCX, WPG, DCX, EPS, JPG, PCT, SHP, and MIF.
- Export formats include: WMF, CLP, DXF, CGM, TIF, BMP, TGA, PCX, WPG, JPG, PCT, and DCX.
All Golden Software products are year 2000 compliant. Golden Software represents and warrants that SurferŽ, Grapher™, MapViewer™, and DidgerŽ are designed to be used prior to, during, and after the calendar year 2000 AD. Surfer, Grapher, MapViewer and Didger will operate during each such time period without error relating to date data, specifically including any error relating to, or the product of, date data which represents or references different centuries or more than one century.
- Windows 95/98, NT 4.0
- Suggested 20 MB of free hard disk space.
- Suggested 16 MB RAM.
- 800 X 600 minimum monitor resolution.
Learn more about Golden
Software Products on this CD!
Home * Surfer
* Grapher * MapViewer
* Didger
Please visit the Golden Software web site
at
http://www.goldensoftware.com!
While visiting the web site, you'll be
able to
buy Grapher or
download a demo copy!
Copyright 1997 - 2000, Golden Software, Inc.

