What's New in Grapher™ 2?
Grapher is now a full 32 bit program!
Grapher 2 runs on Windows 95/98 and NT 4.0. The 32-bit vrsion increases the speed of graphing operations, provides better stability and supports long file names. Also, Grapher 2 supports Excel 97 files!
Import and Export Graphs in Numerous Formats
Many new import and export formats have been added.
- Import options: GSB, BNA, DLG, LGO, LGS, DXF, PLT, BLN, CLP, WMF, TIF, BMP, TGA, PCX, WPG, DCX, EPS, JPG, PCT, SHP, and MIF.
- Export Options: WMF, CLP, DXF, CGM, TIF, BMP, TGA, PCX, WPG, JPG, PCT, and DCX.
Easily Add Text and Mathematical Equations to Graphs
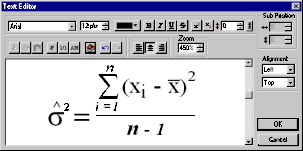
Easily add text objects to graphs using Grapher's new text editor. You can select any typeface, font size and color. Add superscripts, subscripts, and symbols to your text. Automatically enter current dates and times. Create complex mathematical equations and include them in your graph.
Develop complex mathematical
equations with the text editor to
use in text boxes or axis labels
enlarge
graphic
Automate Repetitive Tasks with Golden Software's Scripter Program
Automate repetitive graphing tasks with Grapher's new scripting language. Grapher's Scripter™ uses a BASIC syntax and can be called from other OLE compliant applications including Visual BASIC for Applications (VBA).
Undo and Redo Command Added!
Set multiple levels of Undo (up to 25).
Create 3 New Graph Types!
Three new graph types have been added to Grapher. Create polar graphs, pie charts, and histograms in addition to line, symbol, function, bar, and hi-low-close graphs.
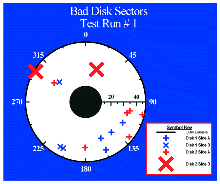
Display degree, radian, or grad data versus a radial distance using Grapher's polar graph. The degree, radian, or grad data are displayed on a circular angle axis. The second axis is a radial axis showing the distance from the center of the circle.

Use the Polar plot to display degree,
radian, or grad values versus a radial
distance
enlarge graphic
Histograms provide a visual impression of the distribution of data. Use histograms to display data based on absolute or relative frequencies. The class ranges can be defined, or Grapher can define the ranges automatically. You have full control over line styles, tick marks, labels, and text objects, and you can add a Gaussian fit to the data.

Histograms use a scaled x axis and
display the frequency of occurrence in
the y direction
enlarge graphic
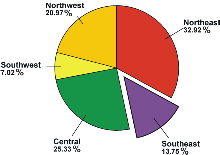
Use Grapher's Pie Chart to display data as proportional slices of a circle. Each data value is divided by the sum of the data to determine the size of the slice. Pie Charts are a colorful way to display data!

Pie charts are a colorful way to display data!
enlarge graphic
Create Templates for Use with Multiple Data Sets
Use Template Graphs to set graphing preferences in Grapher. Once a template graph is created, use the template with any data set. Templates can be very simple or very elaborate. Use the template to set options such as the number of decimal places on axis tick mark labels, label angles, axis labels, graph titles, line plot colors, or any other graphing option.
Digitize XY Coordinates from Graphs
Digitize X and Y values from a graph. Grapher automatically enters the digitized points as text in a report window. The digitized points are saved as ASCII text (TXT) or Rich Text Format (RTF).
Easily Display and Organize Graph Objects
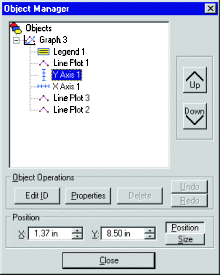
The new object manager graphically displays the organization of all objects and plots held within the plot document. This feature makes the editing of objects within a graph much easier. Simply open the object manager, select the object and proceed to the dialog box that controls the attributes for that feature. Move objects to the foreground or background by re-arranging the drawing order. Change the size, position and ID for axes, lines, or any object in your graph.
Use the Object Manager to view and
edit all the objects on the graph
enlarge graphic
New Full-Featured Worksheet
- Print, save and edit the worksheet contents.
- The worksheet is now double precision. Up to 15 digits can be used without loss of precision.
- Up to five million rows and columns can be accommodated by the worksheet. (The actual amount of rows and columns depends on the computer's available RAM.)
- Open and save the worksheet contents in the following formats: XLS, SLK, WKx, WRx, CSV, TXT, DAT, BNA, and BLN.
- Control row height as well as column width.
- Sort the worksheet on up to three columns.
- New worksheet cell formatting includes background colors.
- An entire suite of statistics functions has been added for use with worksheet data.
- Automatically insert mathematical functions when performing worksheet transforms.
Additional Features
- Customize Grapher's default settings.
- Create custom line styles, custom colors, and custom fill patterns more easily.
- Add arrowhead End Styles to lines.
- Add improved fit curves to the data, including Linear, Log, Exponential, Power, Spline Smooth, Polynomial, Orthogonal Polynomial, Linear through Origin, and Running Average.
- Define custom fit curves and apply them to the data.
- Create custom-spaced grid lines that are not dependent on tick spacing.
- The new Paste Special command includes options to select object format information when pasting from other applications.
- Use the new OLE commands to embed or link graphs between Grapher and other programs.
- Move objects forwards and backwards one step at a time in front of or behind other objects.
- Add new plots, legends, or axes to an existing graph.
- Create one legend for multiple graphs or create one legend for each graph.
- Control the symbol size in legends.
- Dock the three new toolbars in any location around the Plot
Document window, or display the toolbars as palettes in the window.
Learn more about Golden
Software Products on this CD!
Home * Surfer
* Grapher * MapViewer
* Didger
Please visit the Golden Software web site
at
http://www.goldensoftware.com!
While visiting the web site, you'll be
able to
buy Grapher or
download a demo copy!
Copyright 1997 - 2000, Golden Software, Inc.

