GeoWorld Articles
|
Further Understanding Spatial Patterns and Relationships ( |
Feature article for GeoWorld,
August 1998, Vol. 11, No. 8, pgs. 42-47
<Click
here>
right-click for a printer-friendly version of this paper (.pdf).
Visualize
Realistic Landscapes: 3-D Modeling Helps GIS Users Envision
Natural Resources
By Joseph K. Berry,
David J. Buckley and Craig Ulbricht
Introduction
Maps are abstractions of reality. They use long-established
techniques, patterns and symbols to summarize the real world as visual
references. The distinction between
reality and cartographic rendering, however, changes with a digital map.
A GIS' data management and modeling capabilities provide
powerful tools to track landscape conditions and conceptualize spatial
relationships. In natural resources, for example, map analysis is used to
develop harvesting plans that consider a complex set of environmental and
economic concerns. Various scenarios reflecting different management objectives
can be rapidly generated. But an effective means to visualize the results and
communicate aesthetic concerns had to wait for another generation of computer
technology.
From movie-making to the scientific community, dramatic
advances in 3-D visualization are taking hold. Within the next few years
"rendering pallets" composed of realistic trees and rocks will become
as common as color pallets in commercial GIS. More realistic 3-D renderings of
landscape elements will form snapshots of analysis results, providing a glimpse
of aesthetic as well as environmental and economic concerns. Sequencing a
series of snapshots will animate movement through a landscape, or through time
when coupled with a simulation model (e.g., vegetation growth). Today's 3-D
visualization techniques are on the verge of constructing virtual realities
that are difficult to differentiate from photographs.
The Need for 3-D
Visualization
In most areas, the requirement to consider visual
aesthetics of proposed resource development has been mandatory. To date, most organizations
satisfy this requirement by presenting relatively simple 3-D perspectives
showing proposed developments from key viewpoints. Such representations often
are submitted as part of a public review presentation supplemented by
photographs manually altered to provide a "best guess" of the
development's impact.
Two primary factors have spurred the requirement for more
realistic visualization tools. First, there's a general trend in natural
resource management toward more detailed designs that use small treatment areas
scattered across a large landscape. Second, public scrutiny and tighter
guidelines are dictating better and more accurate planning, often at the
watershed scale. Such factors have fueled a demand for visualization
capabilities. As a result, visual impact assessments--and their "before
and after" simulations— have become key elements of the submission and
approval process.
The term "visualization" has become a hot topic
in the GIS industry during the last several years, and capabilities to
represent and animate 3-D images of the landscape are coming online. For
example, the recent release of ArcView 3-D Analyst
from Redlands, Calif.-based ESRI Inc. provides visualization capabilities in a
PC environment that once were reserved for UNIX-based GIS products. In
addition, features such as dynamic rotate, pan and zoom by using the mouse, and
polygon feature extrusion (typically used with buildings) provide a Virtual
Reality Modeling Language (VRML) 3-D-like capability that's effective for visualizing
many GIS datasets. Even with such developments, however, today's conventional
GIS 3-D capabilities still don't satisfy the explicit requirements for
realistic representations in natural resource applications.
Existing
Technologies
Computer visualization methods range from simple 3-D
perspective diagrams to complete virtual realities. Four distinct categories of
visualization techniques can be identified (McGaughey
1997): geometric modeling, video imaging, geometric video imaging and image
draping.
Geometric modeling techniques build 3-D geometric models of
individual features (or components) such as trees, buildings and roads. The
individual objects are assembled to create a forest stand or landscape view
depicting the perspective from a given viewpoint. The most common use of the
approach uses simple 3-D cones for tree symbols.
Video imaging is a computer technique that "cuts and
pastes" digital photographic images to represent landscape changes. The
approach produces high-quality visualization output, but it's manually
intensive, contains no direct geo-referencing to a GIS database and often
suffers from the artistic/subjective nature of the creation process. In many
instances graphics software, such as San Jose, Calif.-based Adobe Systems
Inc.'s Adobe Photoshop, is used to manipulate images.
Geometric video imaging is a hybrid approach that combines
video-imaging techniques with geometric modeling, typically undertaken within
GIS. Berris (1990) illustrated the possibilities for
using such an approach in forestry applications, yet it's rarely used on a
production basis. The primary difficulty arises in accurately georeferencing the photographic video images with the 3-D
perspective framework (i.e., wireframes) generated by the GIS.
Image draping is a well-established technique in GIS. It
involves draping an image, such as a digital orthophoto
or classified satellite imagery, onto a 3-D perspective view. Image draping
results in good texture and can produce visualizations suitable for depicting
landscape-scale vegetation patterns. But image draping isn't effective for
representing key viewpoint visualizations. The forefront of the image often
suffers from coarse pixelization, resulting in an
abstract impression.
Determining the best way to generate visualizations
involves several factors: the representation scale required, the detail level
needed and the availability of source data. McGaughey
(1997) compares the four visualization techniques and offers general strategies
for employing visualization in forestry-related projects.
Visualization
Software
Two different, and to date unconnected, software sources
are available for visualizing forests: commercial GIS/computer-aided design
(CAD) software and scientific/research programs.
Commercial GIS/CAD software is characterized by traditional
3-D mapping techniques, such as wireframe terrain characterization with
light-source-shaded perspectives as well as vector and image draping. These 3-D
views can be generated from specific x,y
viewpoints, supporting a wide range of surface-definition parameters.
Full-featured GIS software also supports image-rendering
enhancements (e.g., atmospheric effects such as sky, fog and haze). Recent
additions support the generation of map animations using standard MPEG encoding
formats. However, GIS and CAD software typically don't have 3-D object
rendering capabilities. Some users have integrated GIS capabilities with photo
imaging, but these are usually project-based efforts and typically don't
reflect a readily available functionality.
A host of specialized visualization tools have been
developed within the scientific and research community (see "Software
Packages for Forest Visualization," page 44), especially for natural
resource-based visualization. Many of these programs reside in the public
domain and are readily available via the Internet. Such software tends to be
project-based and includes specific capabilities required for natural resource
applications.
Typical characteristics of scientific visualization
software include 3-D object rendering (geometric modeling), 3-D
"fly-bys" (map animation), image morphing capabilities, VRML and a
distinction regarding stand vs. landscape project scales.
Project Scales for
Visualization
Visualizations can be characterized at three different
project scales for natural resources: individual plot, stand (forest parcel)
and landscape levels. Each scale represents a specific detail level and unique
requirements for generating realistic visualizations. However, many projects
require visualization at different scales. Landscape-level visualizations often
are used to show altered vegetation patterns and visual effects within a valley
or watershed. Stand- or plot-scale visualizations typically are used to show
harvest unit layouts or specific stand treatments. Stand and plot scales tend
to be used more for engineering purposes, whereas landscape-level visualization
is used for planning and public presentation.
Plot-level visualization usually covers just a few acres,
with the objective of depicting forest structure, habitat quality and silviculture prescriptions. Tree detail includes species,
height, diameter and crown/foliage characteristics. Typical data requirements
are individual tree characteristics, understory conditions and spatial
arrangement of individual scene elements. Most plot-level programs don't
include terrain variations.
Stand-level scales occur across much larger areas (up to
500 acres), with the goal of projecting area layout, such as harvesting
parcels. Tree detail encompasses species as well as generalized height, color,
density and crown characteristics. Data requirements include topography, ground
surface characteristics, stand polygons, tree size, species distribution and general
understory conditions.
Landscape scales involve areas greater than 500 acres,
tracking vegetation texture, spatial arrangement of stand types, project area
location, visual quality and insect or other stand damage effects. Tree detail
is as high as stand scale in the foreground, but diminishes to texture mapping
at greater distances. The data requirements are similar to those of stand-level
visualizations.
As a general rule, the larger the project area the less
detail required in the input data and final visualizations. Due to
significantly larger interest areas, greater data volumes often are needed to
generate landscape-level visualizations. At stand and plot scales, more
detailed individual tree characteristics typically are required. In most cases,
landscape representations depend on users sampling GIS-based polygon vegetation
inventories for tree characteristics and then generating tree lists for placing
trees on a 3-D landscape view. This is a critical requirement for using
GIS-based polygon inventories, rather than field data, as the primary data
input.
In addition, multivariate sampling techniques usually are
required. However, modeling and sampling algorithms can be complex, depending
on the specifications and the source inventory data's detail level. Robust
inventory sampling techniques remain the foundation for generating realistic
treed visualizations. To date, such functionality has been lacking with most
GIS and 3-D visualization software, and little integration has occurred.
Numerous visualization tools are available for generating
views at plot or stand level. Most notable is the Stand Visualization System
(SVS) (McGaughey 1997) used within the U.S. Forest
Service (USFS) and other government agencies (Figure 1). SVS has been linked to
the USFS Forest Vegetation Simulator (FVS) program, which simulates at the
stand level tree birth, growth and mortality levels.
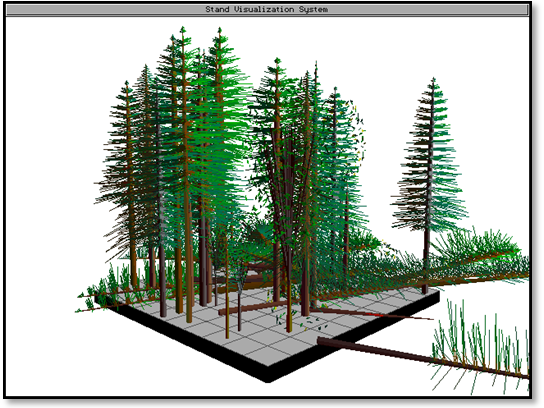
Figure 1.
A typical SVS visualization using stand-level input.
SVS helps visualize and interpret FVS output as it
generates 3-D graphic images that depict stand conditions represented by
individual stand components, such as trees, shrubs and down material. Images
produced by SVS, although abstract, provide a readily understood representation
of stand conditions and help communicate silvicultural
treatments and forest management alternatives to a variety of audiences.
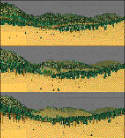
Figure 2.
A SmartForest visualization
representing forest growth model output for 1994 (top), 1996 (middle) and 1998
(bottom). Note increased forest cover, particularly in the distance.
SmartForest, developed at the
A New Era in 3-D
Visualization
The primary requirement of operational natural resource
applications is the need for realistic tree rendering, particularly for key
viewpoint visualizations in which terrain and tree screening are essential. As
previously mentioned, the geometric modeling technique is the primary method to
satisfy this requirement.
Factors that restrict most visualization software in
rendering treed surfaces effectively include their limited ability to create
realistic 3-D tree objects, resulting in stylized 3-D cones to represent trees.
This can be marginally effective for extensive coniferous landscapes, but
doesn't accommodate mixed-wood or deciduous forest landscapes. Also, such an
approach creates an unnatural impression in the foreground.
Performance times for rendering geometric modeled surfaces
can be long enough to prohibit interactive processing. But perhaps the most
limiting factor to date has been that selecting objects for rendering is rarely
tied to GIS-based vegetation/timber inventories. This usually results in
unrealistic representations of tree density, height and species composition,
thereby restricting the applicability of most visualization tools in
operational GIS environments.
The next generation of realistic visualization software
share several key capabilities that go beyond the requirements for vastly
improved performance. Such capabilities include:
• 3-D
object design tools to build custom symbols based on characteristics such as
tree type, color, percent maturity, size at various maturity stages, hierarchy
level of branching, degree of randomness for branching, density and
distribution of leaves, and internal and external shadowing
• 3-D
object rendering of symbols such as trees, buildings and other manmade features
• Simulation
of atmospheric effects such as fog, haze and clouds
• Texture
mapping to support realistic rendering of polygonal features such as roads,
meadows, open water and background sky
• GIS-based
polygon sampling to generate explicit tree lists (x,y tree locations) based on common vegetation
inventory attributes such as species, average tree height, crown closure and/or
stand exams
• Multimedia
capabilities, including map animation for generating flexible, 3-D "walk-throughs" and "fly-bys" using tree and
object rendered images
• Interactive
geo-query tools for querying 3-D visualizations enabled by seamless links to
GIS-based attributes, providing a framework for a suite of 3-D landscape design
capabilities
To date, few visualization programs incorporate these
extended capabilities. Although several programs provide basic 3-D rendering
capabilities, most aren't tightly integrated with commercial GIS software in
production or operational forestry settings. This integration level should be
considered a priority for visualization software developers, because the
ability to create 3-D visualizations based on GIS data inventories created by
natural resource agencies is paramount.
A Virtual
A "tree designer" is a key component to realistic
3-D rendering because it enables users to interactively design custom sets of
3-D trees. Changes in tree object parameters allow definition of species
variations, seasonal impacts, stage of maturity and
object type (e.g., no leaves, stumps, snags, etc.). Completed designs are
identified as specific tree codes and saved as rendered bitmaps with different
light-source shadings. The bitmaps then can be used for subsequent 3-D
rendering using texture-mapping techniques. With this approach, surfaces can be
rendered quickly because object shading is undertaken at the tree design stage,
not during rendering. Texture mapping is ideal for representing background
treed areas, whereas geometric modeling is often more appropriate for
foreground areas.
Texture mapping with predefined symbols provides
significant performance improvements over traditional methods of rendering
treed surfaces, resulting in truly interactive visualization. The orientation
of the visualization view allows users to dynamically rotate, pan and zoom ("fly") the rendered landscape. Viewing
parameters also can be preset to a defined set of viewpoint parameters, such as
those defined in the GIS environment.
The following factors will help make the next generation of
rendered views more realistic than traditional visual techniques:
• Atmospheric Effects. Atmospheric effects
can be added as visualization events through several different techniques,
including sky, haze and fog representation.
• Polygon Texture Mapping. Polygons can be
rendered using bitmap-based texture mapping, which allows the pseudo-realistic
rendering of roads, harvest blocks, silvicultural
treatments (scarified, early treatment, plantation, etc.), water and other
landscape features. Figure 3 illustrates simple polygon texture mapping for
harvest blocks and logging roads applied to a typical mixed forest rendering.
• Polygon Boundary Extrusion. Using 2-D
polygon geometry, features can be extruded onto the surface as 3-D containers
(polygon walls). User-definable parameters include wall height as well as symbology for display of nodes, arcs and vertices. Figure 4
shows GIS polygons as containers ready for filling with rendered trees. The
rendering process is analogous to color fill (paint bucket) in a standard
painting package, except a 3-D object rendering pallet is used instead of a
conventional color pallet.
• 3-D Digitizing and Query.
Full 3-D model capability for on-screen digitizing polygons
on the surface and rendering or removing trees. Object (tree) removal
can use either a "percent removal" (complete removal of objects) or
"harvest" approach (partial removal of objects).
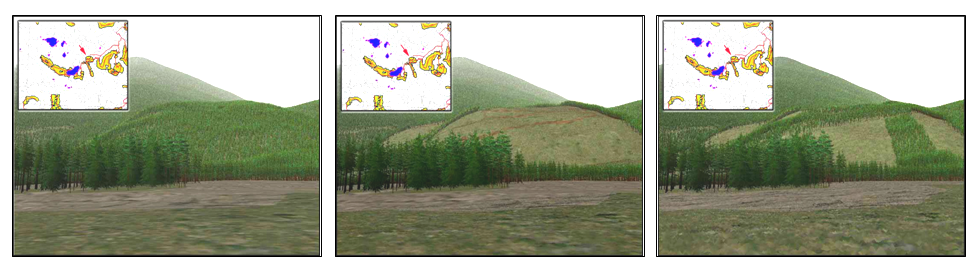
Figure 3. A figure illustrates the detail
level of rendered trees and simple polygon texture mapping techniques applied
to a proposed harvest area and logging roads. Note the different tree symbols
intermixed to represent different species.
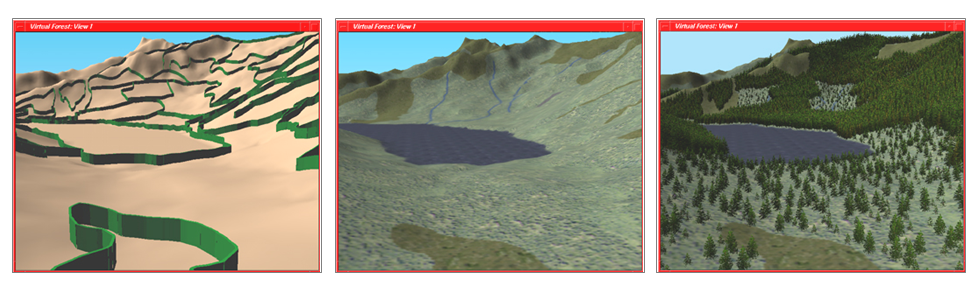
Figure 4. Polygons are represented as
containers ready for rendering with trees. Multiple polygon layers can be represented,
including inventory, lakes and proposed harvest blocks. Texture mapping also
can be used to provide a more realistic look to the underlying surface.
Visualizing What
Might Be
For thousands of years, traditional mapping has used a
variety of abstract symbols, colors and patterns to characterize a landscape.
Conventional GIS software extended these procedures to the digital map and
linked map features to attribute data. Advanced analytical tools provide
entirely new ways to address complex spatial relationships and model
alternative management actions. Until recently, however, the rendering of GIS
results primarily has been restricted to the same set of display techniques
used in manual cartography.
The next generation of visualization techniques radically
changes the image of mapping. As shown in Figure 5, users will be able to
consider different visions of the future and see the results in renderings as
realistic as a snapshot. Users will be able to apply 3-D rendering pallets in
conjunction with conventional 2-D color pallets. The textured surface will
complement the classic 2-D GIS thematic map. However, it's critical that these
visualization capabilities be positioned to leverage the substantial investment
already made by most companies and government agencies in GIS databases.
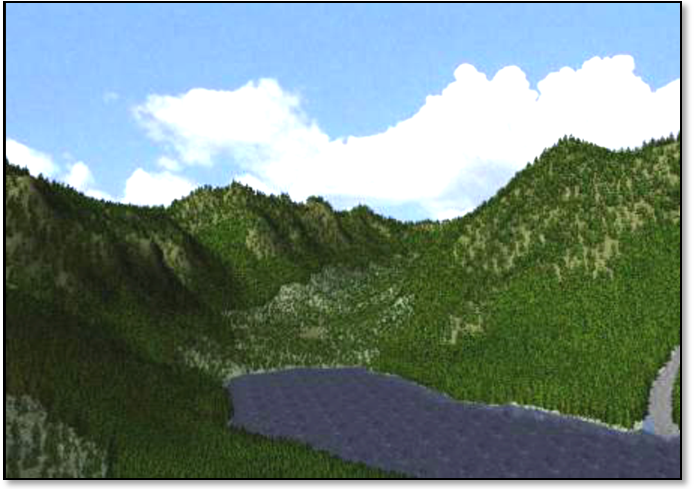
Figure 5. A treed surface uses the polygon
containers identified in Figure 4. This view overlooks the lake and adjoining
harvest blocks. The tree species (primarily Western Hemlock), height and
density were derived directly from an ARC/INFO polygon
inventory coverage.
References
Berris, C. 1990. GIS
and Computer Video Imaging in Forest Landscape Management. GIS'90
Symposium Proceedings,
McGaughey, R.J. 1997. Visualizing
Forest Stand Dynamics Using the Stand Visualization System. Proceedings
of the 1997 ACSM/ASPRS Annual Convention and Exposition, April 7-10,
McGaughey, R.J. 1997. Techniques
for Visualizing the Appearance of Timber Harvest Operations.
Acknowledgments
Much of
the summary information provided in this paper was compiled by Robert J. McGaughey of the U.S. Forest Service, Pacific Northwest Research
Station. He is the author of SVS and a leading researcher in the field of
forest visualization. He can be reached via E-mail at mcgoy@u.washington.edu. For more information on 3-D landscape
visualization and the
_____________________________________
Berry is principal of Berry and
Associates/Spatial Information Systems Inc. and a Special Faculty member at