|
Who’s Minding the
Farm?: Precision Agriculture, Yield Mapping and Site-specific Farming |
Further Understanding Spatial Patterns and Relationships ( |
Feature article for GeoWorld,
February 1998, Vol. 11, No. 2, pgs. 46-51
<Click here> right-click for a
printer-friendly version of this paper (.pdf).
Who’s Minding the Farm? (Part 1)
Precision Farming Modernizes Conventional Techniques
(Part 2)
Yield Mapping
Who’s Minding the Farm?: Precision Agriculture, Yield
Mapping and Site-specific Farming
 (Part 1) by Joseph K Berry
Big changes are
underway in agriculture, thanks to GIS and related spatial technologies. As a result, farmers are reaping cost savings
and production increases as well as improved stewardship and environmental
benefits.
Introduction
To many, precision farming seems like an oxymoron. With mud
up to the axles and 400 acres left to plough, precision seems worlds away. Yet site-specific
management makes sense to a rapidly growing number of farmers. Mapping and
analyzing variability in field conditions, and linking such spatial
relationships to management action, places production agriculture at the
cutting edge of GIS applications.
Underlying
Principles
Until the 1990s, maps played a minor role in production
agriculture. Most soil maps and topographic sheets were too generalized to
apply at the farm level. As a result, the principle of whole-field management
based on broad averages of field data, dominated management actions.
Weigh-wagon and grain elevator measurements established a field's yield
performance, and soil sampling determined the typical nutrient levels within a
field. Farmers used such data to determine best overall seed varieties,
fertilization rates and a bushel of other decisions-all treating an entire
field as a uniform whole within its boundaries.
Site-specific management, on the other hand, recognizes the
variability within a field and involves doing the right thing, in the right
way, at the right place and at the right time. The approach involves assessing
and reacting to field variability by tailoring management actions-including
fertilization levels, seeding rates and selection variety-to match changing field
conditions. It assumes that managing field variability leads to cost savings
and production increases as well as improved stewardship and environmental
benefits.
Blending
Technologies
Site-specific farming isn't just a bunch of pretty maps;
it's a set of new technologies and procedures linking mapped variables to
appropriate management actions. Such procedures integrate several key elements:
the Global Positioning System (GPS), on-the-fly data collection devices, GIS
and variable rate implements.
Modern GPS receivers can establish positions within a field
to about a meter. When connected to a data collection device, such as a
yield/moisture meter, these data can be "stamped" with geographic
coordinates. Several portable "heads-up" digitizing devices allow
farmers to sketch conditions, such as weed infestations, on a map or aerial
photo backdrop. GIS maps the field data so a farmer can see the conditions
throughout a field. GIS also can be used to extend yield visualization to
analyzing relationships among yield variability and field conditions.
Once established, these relationships derive a
"prescription" map of management actions required for each location
in a field. The final element, variable rate implements, notes a tractor's
position through GPS, continuously locates it on the prescription map, then
varies the application rate of field inputs, such as fertilizer blend or seed
spacing, according to precise instructions for each location. Combining
technologies such as GPS, GIS and intelligent devices and implements provides
the mechanisms to manage field variability. The maturation and
commercialization of these technologies have made the concept practical.
Data Processing
To date, most analysis involved visual interpretations of yield
maps. By viewing a map, potential relationships between yield variability and
field conditions spring to mind. These "visceral visions" and
explanations can be drawn through the viewer's knowledge of the field. More
recently, data visualization is being extended through map analysis at three
levels: cognitive, analysis and synthesis.
Precision farming's foundation occurs at the cognitive
level, where desktop mapping is used to manage and store mapped data. At the
analysis level, map analysis is used to discover relationships among variables
such as yield and soil nutrient levels. This step is analogous to a farmer's
visceral visions of relationships, but uses the computer to establish more
detailed mathematical and statistical connections. Although this step is
somewhat an uncomfortable "leap of scientific faith," it extends data
visualization by investigating the coincidence of the variation patterns among
map sets. The results relate yield goals to specific levels of farm
inputs-traditional agricultural research, but tailored to a farmer's
"backyard."
The synthesis level evaluates newly derived relationships
to formulate management action. The result is a prescription map used to guide
the intelligent implements as they "variable rate control" the application
of field inputs. Or the analysis might discover an area of abnormally low yield
as linked with a section of old drainage tile in need of repair. Further
analysis might locate areas in which simulated yield increases under drier
conditions justify the installation of additional drainage tiles.
Technical Issues
The precision farming process can be broken into four
steps: data logging, point sampling, data analysis and spatial modeling (see figure
1). Data logging continuously records measurements, such as crop yield, as a
tractor moves through a field. Point sampling, on the other hand, uses a set of
dispersed samples to characterize field conditions (e.g., phosphorous,
potassium and nitrogen levels). The data derived by the two approaches are
radically different- a "direct census" of yield that consists of
thousands of on-the-fly samples vs. a "statistical estimate" of the
geographic distribution of soil nutrients based on a handful of soil samples.
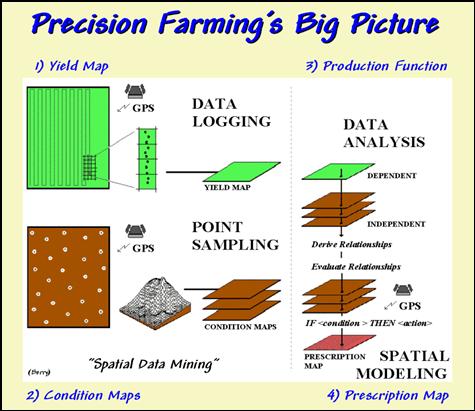
Figure 1. The precision farming process can be broken
into four steps: data logging, point sampling, data analysis and spatial
modeling.
In data logging, issues of accurate measurement, such as
GPS positioning and material flow adjustments, are major concerns. Most systems
query the GPS and yield monitor every second, which at 4mph translates into
about six feet. With differential positioning, the coordinates are accurate to
about a meter. But the paired yield measurement is for a location well behind
the harvester, because it takes several seconds for material to pass from the
point of harvest to the yield monitor. To complicate matters, the mass flow and
speed of the harvester change constantly as different terrain and crop
conditions are encountered. The precise placement of GPS/yield records aren't
reflected as much in the accuracy of the GPS receiver as in "smart"
yield mapping software.
In point sampling, users are concerned about surface
modeling issues (estimating between sample points) such as sampling
frequency/pattern and interpolation technique. The cost of soil lab analysis
dictates "smart sampling" techniques based on terrain and previous
data to balance spatial variability with a farmer's budget. In addition,
techniques for evaluating alternative interpolation techniques and selecting
the "best" map using residual analysis are available in some soil
mapping systems.
In data logging and point sampling, the resolution of the
analysis grid used to geographically summarize the data is a critical concern.
Like a stockbroker's analysis of financial markets, the fluctuations of
individual records must be "smoothed" to produce useful trends. If
the analysis grid is too coarse, information is lost in the aggregation across
large grid spaces; if too small, spurious measurement and positioning errors
dominate the information.
The technical issues surrounding mapped data analysis
involve the validity of applying traditional statistical techniques to spatial
data. For example, regression analysis of field plots has been used for years
to derive crop production functions, such as corn yield (dependent variable)
vs. potassium levels (independent variable). A GIS allows users to regress an
entire map of corn yield on a map of soil nutrients to derive the production
function relating the mapped variables. But should you? Technical concerns,
such as variable independence and autocorrelation, have yet to be thoroughly
addressed. Statistical measures assessing results of the analysis, such as a
spatially responsive correlation coefficient, await discovery and acceptance by
the statistical community, let alone the farm community.
In theory, spatial modeling evaluates the relationships
established during the data analysis phase to determine "optimal"
actions, such as the blend of phosphorous, potassium and nitrogen to be applied
at each location in the field. In current practice, these translations are
based on existing science and experience without a direct link to data analysis
of on-farm data. For example, a prescription map for fertilization is
constructed by noting the existing nutrient levels (condition) then assigning a
blend of additional nutrients (action) tailored for each location-an "If (Condition) Then (Action)" set
of rules. The issues surrounding spatial modeling are similar to data analysis
and involve the validity of using traditional "goal-seeking"
techniques, such as linear programming or genetic modeling, to generate maps of
optimal actions.
Current and future
directions
GIS has evolved rapidly within production agriculture. In
less than 10 years the application has moved from inception to operational
reality. Its current expression emphasizes the generation of yield maps by
linking GPS with on-the-fly yield monitors. Valuable insight is gained by
visualizing field variability, particularly when yield maps for several years
are considered. More advanced applications involve analyzing soil nutrient maps
to derive a prescription map used in variable rate fertilizer control.
The infrastructure for precision farming is in place. Most
manufacturers offer precision farming options with their vehicles and
implements and a growing cadre of service providers offers advice to farmers
interested in adopting the new technology. Opportunities abound in one of GIS'
more important applications and, quite literally, we'll all benefit from its
fruits.
Precision Farming Modernizes Conventional Techniques
 (Part 2) by Grant Mangold
Tracing the effect of site-specific farm management requires a look at
where the industry has been, where it is and where it's headed. Harnessing the
technologies that make precision farming possible promises to empower farmers
to meet the economic and ecologic objectives of their farm businesses.
Site-Specific Managers
When Adam and Eve first picked up a hoe in the Garden of Eden, they
practiced site-specific agriculture—planting seeds, nurturing the seeds and
harvesting the yields. With an innate desire to know and to do, mankind has
progressed past placing a dead fish in every hill of corn, beans and squash.
Now when a farmer or rancher reaches into a toolbox, he or she finds bits and
bytes and satellite parts along with socket sets and drill bits. Computers
connect to combines and crop input applicators driven by geo-referenced data
processed through GIS applications.
Such technologies make sense to modern agricultural producers, many of
whom have spent their careers carefully managing family farms that go back
generations. At the heart of precision farming lies site-specific management,
which involves the ability to collect and control information to accurately and
appropriately address parts of fields for actual needs, rather than whole
fields for average needs. Site-specific managers use information technologies
to turn their data into decisions.
Such farmers follow a precise process, acquiring raw data, analyzing
derived information, adding related knowledge and applying the results with
wisdom. They depend on precise devices to deliver precise data to determine
precise advice. This requires them to inventory practical variability within
their fields, investigate probable causes, instigate possible solutions to
address management opportunities on a site-specific basis and evaluate the
whole process. Farmers finally have tools for real time, on-farm research. As a
result, they have the potential to produce food and fiber more efficiently.
Current Capabilities
Precision farming allows today's agricultural producers, advisors and
researchers to integrate information technologies with numerous field and
office activities. Such tools include GIS, the Global Positioning System,
remote sensing, on-the-go sensors, monitors and controllers. For example, it's
possible today to meter out multiple crop-protection products to specific sites
through irrigation systems and applicators with on-the-go sensors as well as
track yield and crop quality with growth simulation software, sensors and
remote imaging. Data collected remotely or on-site can be sent via new
telecommunication capabilities for near real-time analysis. As a result,
farmers now have new tools to predict the outcome of site-specific
management--weather permitting.
But how many farmers actually use these new technologies? There are
about 300 million cropland acres in the
Yield monitoring appears to be the most extensive site-specific farming
technology. A recent @gInnovator survey of nearly 20 yield monitor
manufacturers estimates 17,000 on-the-go units were used for harvesting North
American crops in 1997. That figure is up from 10,000 in 1996, 4,400 in 1995,
1,200 in 1994, 300 in 1993 and about 50 in 1992. Worldwide, there are perhaps
20,000 on-the-go yield monitors. That's about 3% of the world's combines. About
half have GPS capabilities, so the data collected can be turned into maps--a
rising trend.
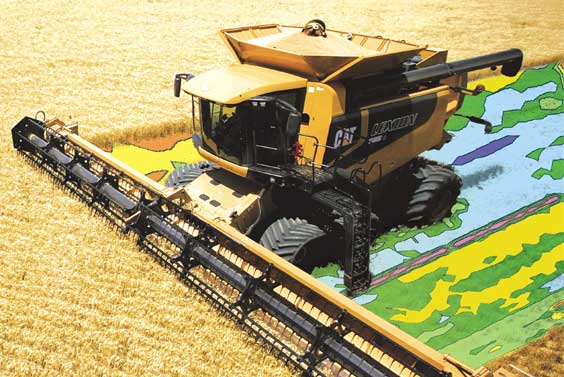
Figure 2. Of the approximately 340,000 farmers with
more than $100,000 in annual sales, almost 50% use computers for farm business,
and 20% have Internet access.
(Courtesy of LEXION Combine Division)
If you figure 1,500 acres per monitor (as some manufacturers suggest),
or perhaps 25.5 million acres, this would be about 8% of
Currently, the acreage under site-specific or variable-rate input
application likely runs less than half the yield monitoring figure.
The 1997 Precision Agriculture Dealership Survey, conducted by Farm
Chemicals magazine and Purdue University, indicates one-third of U.S.
agrichemical dealers sampled in the nationwide survey offer soil sampling with
GPS, and more than 40% perform field mapping. Some 25% provide yield mapping
analysis, 15% handle yield monitor sales and support, 29% offer agronomic
interpretation of GPS data, 80% sell seed and 51% sell enhanced seed. Almost 5%
can perform variable rate seeding, 84% offer custom application services and
50% provide variable rate application. Such figures lead one to project an
increase in site-specific services.
Site-specific management drives farmers to accurate record keeping,
which will direct their decisions. This must be the next transition: from
precision farming to appropriate agriculture--doing the right thing at the
right time in the right place in the right way. Today, the payoff appears to be
in the process, rather than in off-the-shelf precision farming products. The
economics of the practices are site-specific. What farmers need is
"precise advice," which will be determined through more research by
farmers, suppliers and universities.
Focusing on the Future
Future farmers will be plugged
into the planet as never before. They'll use conduits of digital information,
piping data to and from their farm fields. They'll connect with channels of
electronic communication, as they forge new links in the farm-to-food chain.
And they'll work in new ways with new communities of suppliers and customers.
Behind every technology is a philosophy. Most farmers adopting site
specific technologies do so to discover ways to cut their costs, to use inputs
appropriate to the productive capacity of the site, and to optimize their
outputs for a safe and stable supply of food and fiber.
They're not just "farming by the numbers," but they are able
to apply more science to the art of farming. They don't want to become
entrapped by data-driven technologies; they expect to be empowered with
decision making tools. Farmers are more like artists than accountants. Sure,
they watch the bottom line. But producing a crop puts all their knowledge and
wisdom on the line every year, meeting head-on the risks of products, prices
and precipitation. Some precision farmers look for future prescriptions of
precisely what to do when. Others expect the development of site-specific
"recipes" to work for more farmers, giving them more latitude to put
their gray cells in charge of the black boxes running their farms--art with
science.
Weather remains the No. 1 variable farmers deal with every day. They
can't control that variable, but they can seek to understand how to plan and
manage variability as a fact of business. As a result, farmers are the
front-line integrators of information and technology. They're turning
information technologies and geographic information systems into geographic
management systems as part of a toolbox of overall farm management tools and
techniques aimed at reducing risk and optimizing efficiency.
This becomes even more important when you consider the future structure
of agriculture. The industry is moving toward consolidation and vertical
integration, along with the adoption of information technologies and
biotechnologies. As a result, there may be fewer farmers. This suggests forward-thinking
producers must forge new links on the farm-to-food chain.
"What you know about what you can grow" will become the key
to farm management. The agricultural industry will become increasingly involved
in planting, growing, harvesting and processing "information" along
with value-added crops.
Site-specific
management drives farmers to accurate record keeping, which will direct their
precision farming decision making. This must be the next transition: from
precision farming to appropriate agriculture--doing the right thing at the
right time in the right place in the right way. At the heart of it all will
remain temporal and spatial decision making--made more effective by GIS working
in tandem with other spatial information technologies.
Yield
Mapping
 (Part 3) by Neil Havermale
The GIS-based crop yield data layer is the most important enabling
element in the precision farming revolution. An accurate yield map integrates
nature's climatic effects and a farmer's management decisions. A yield map can
identify natural and manmade variations in a farmed landscape, a crop's genetic
expression in a particular season's environment and more.
There are four general sources of bias in most, if not all, "as
recorded" yield data sets: antenna placement, Global Positioning System
(GPS) latency, instrumentation and modeling errors. Because actual yield is the
basis of future prescriptive action in a site-specific farming system, spatial
accuracy--when tied to a proper model of a combine's threshing
action--determines the final quality of any prescriptive method.
Antenna Offset. Until the last two years, yield monitors
were installed as retrofits on new and old combines. Accurately placing a GPS
antenna on a combine's centerline is critical. With the increasing accuracy of
differentially corrected GPS to within a meter, a foot or two of misplacement
can result in the antenna offset bias pattern shown in the accompanying
figures.
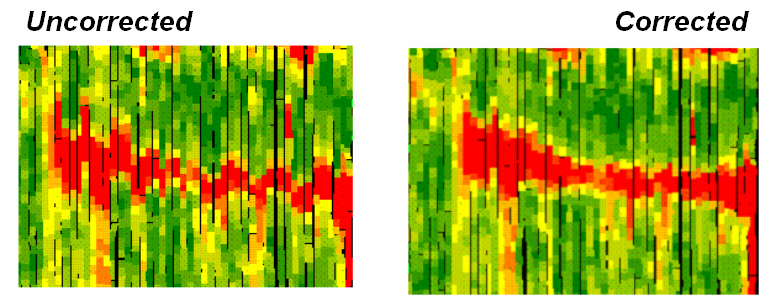
Figure 3. Accurately placing a GPS antenna on a
combine's centerline is critical, as illustrated by an example of uncorrected
(left) and corrected antenna offset (right).
GPS Latency. Latency in various GPS receivers' NMEA
navigation strings has proven to be less than "real time." In fact,
one of the early differentially corrected GPS systems widely integrated into
the leading yield monitor had as much as a 6-8 second latency. The receiver's
latency in this case was directly tied to the differential correction of the
raw pseudo-ranges.
Instrumentation Error. There are two groups of current sensors in
the GPS combine: mass deflection strain gauges and clean grain volume
estimation via infrared beams. A simple examination of the placement of either
of these designs in the combine will reveal that any slope in the field can
easily distort the geometry of the clean grain path of travel. None of the
current yield monitors provide a sensor or correction for instrumentation
failure due to slope.
Model Deconvolution. The modern combine is a marvel. It can
digest literally tons of biomass in an hour, sorting that biomass into clean
grain measured by a grain flow sensor. Material other than grain goes out the
back as chaff. When properly adjusted and operated, the loss of grain out the
back with the chaff will be less than 1%. A combine is a lot like a lawn mower.
It can stall if pushed too quickly into tall, heavy and wet grass, so its
general design has important features that buffer these effects.
Site-specific
farming isn't a new idea. It's as old as childhood stories of Indians showing
pilgrims how to plant corn with fish as a source of fertility. The promise of
modern GIS applications tied to GPS offers users the ability to again
micromanage farming practices--maybe not to a single plant like the pilgrims,
but certainly to 1/100th of an acre. Precision farming systems literally represent
a growing opportunity.
__________________________
Joseph K Berry is principal consultant with Berry &
Associates, Fort Collins, Colorado,
Neil
Havermale, Farmers Software Association, 800 Stockton Ave., Fort
Collins, CO 80524; E-mail: neilh@redhensystems.com.
Grant
Mangold, editor, ag/INNOVATOR,