Applying MapCalc Map Analysis Software
Summarizing Map Regions: A watershed manager needs to identify the
average slope and other terrain statistics for a set of watersheds. This information will be used in concert with
other information to estimate surface runoff and erosion potential for the
watersheds.
<click
here> for a printer friendly
version (.pdf)
Processing Flow.
Base Maps. The Base Maps needed include:
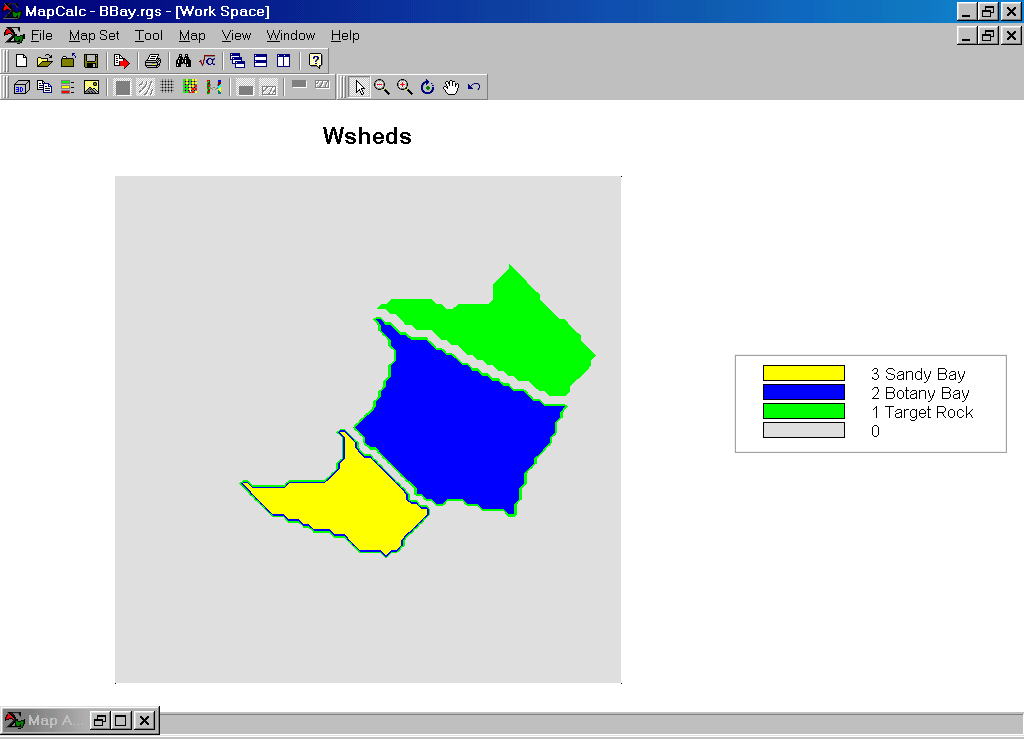
Watersheds Map.
The target Rock,
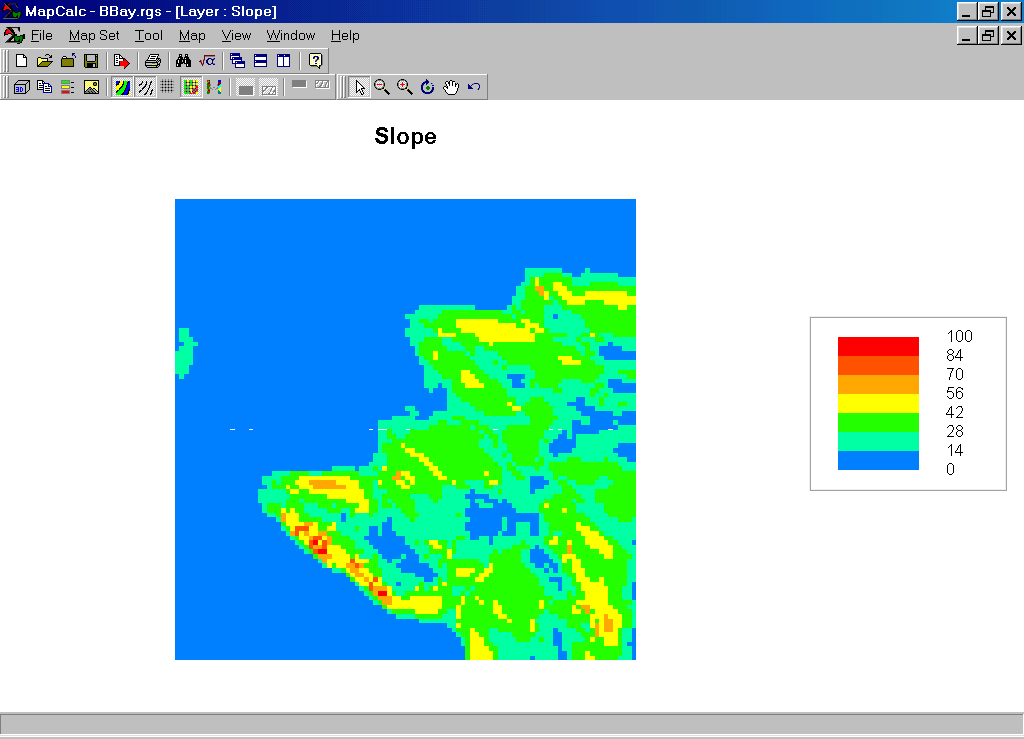
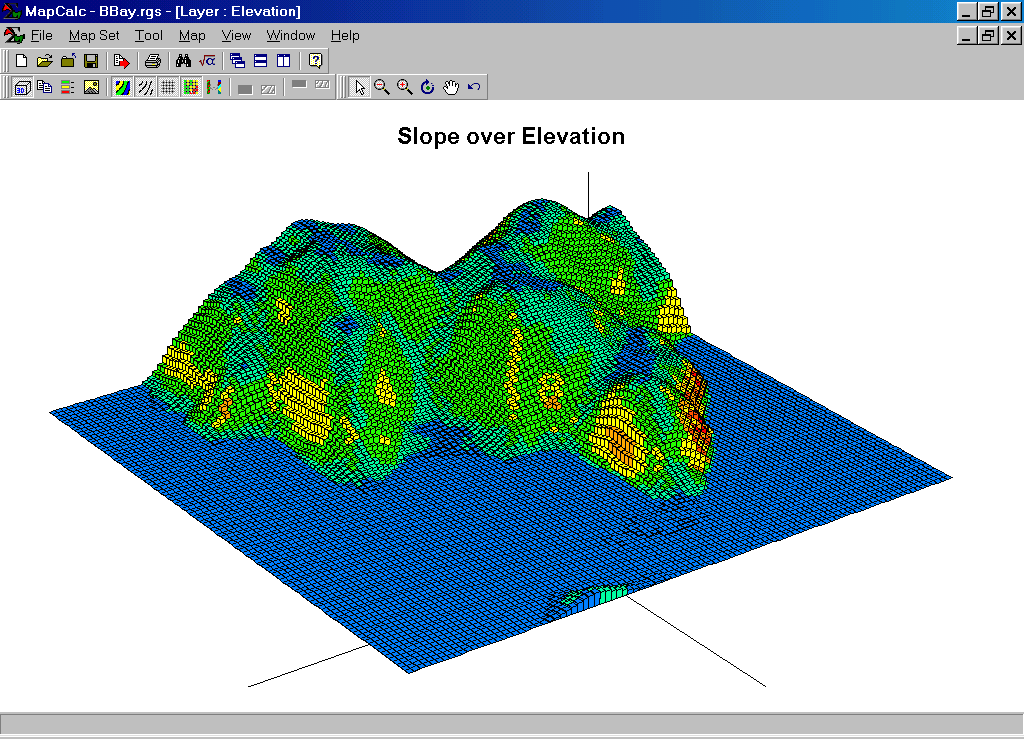
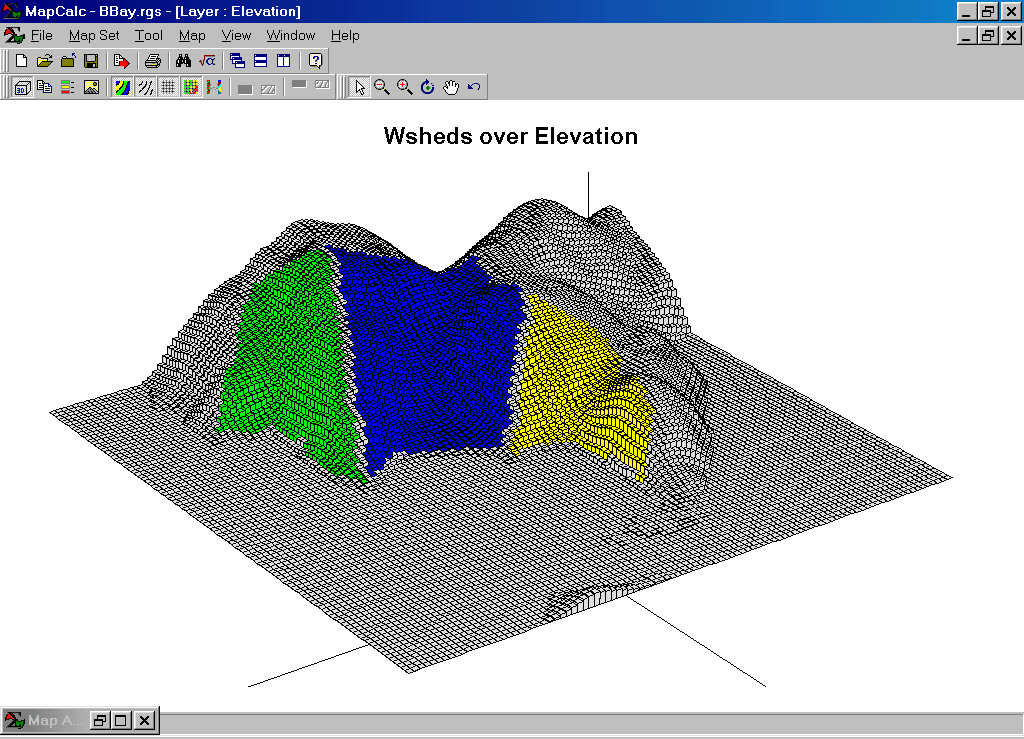
Slope Map. The
slope map for the elevation surface was calculated and stored as a base map in
the
Step 1. The MapCalc operation…
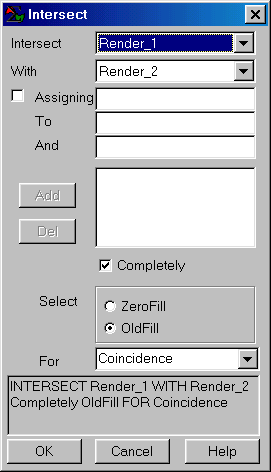
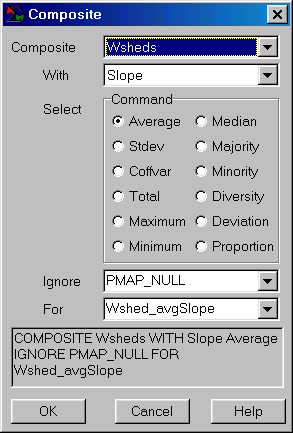 COMPOSITE Wsheds WITH Slope Average
FOR Wshed_avgSlope.
COMPOSITE Wsheds WITH Slope Average
FOR Wshed_avgSlope.
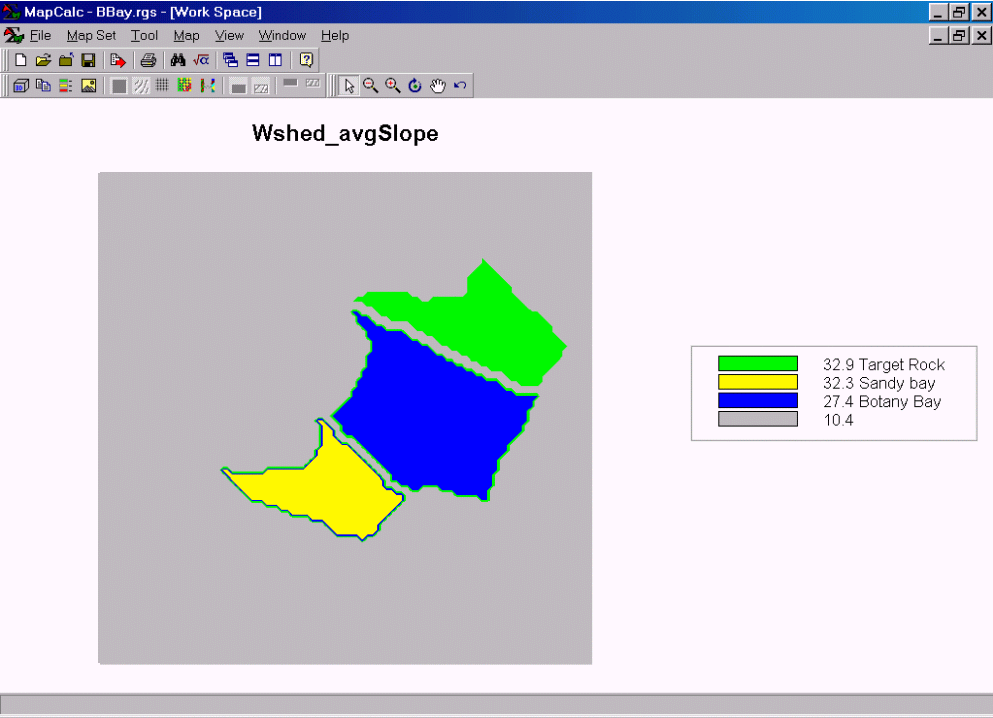
…generates a map that identifies the average slope for each watershed (termed a “region”).
Wshed_avgSlope
Map. Overall, the
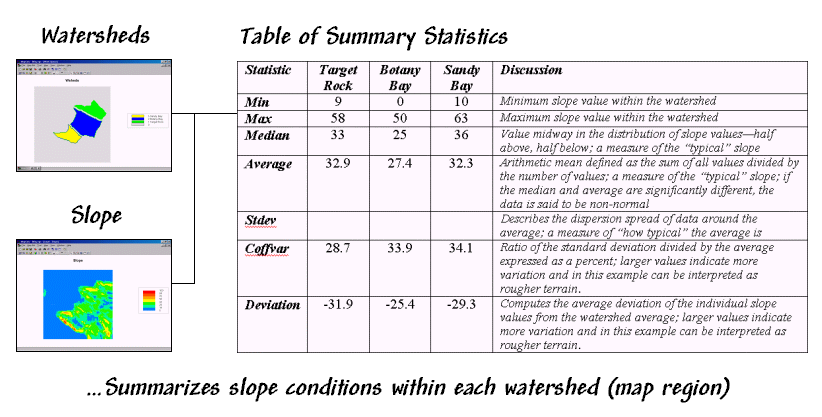
By simply changing in the Composite command’s summary method (radial buttons in the above Composite dialog box) other terrain statistics can be generated…
|
Statistic |
Target Rock |
Botany
Bay
|
Bay |
Discussion |
Min |
9 |
0 |
10 |
Minimum slope
value within the watershed
|
|
Max |
58 |
50 |
63 |
Maximum
slope value within the watershed |
|
Median |
33 |
25 |
36 |
Value
midway in the distribution of slope values—half above, half below; a measure
of the “typical” slope |
|
Average |
32.9 |
27.4 |
32.3 |
Arithmetic
mean defined as the sum of all values divided by the number of values; a
measure of the “typical” slope; if the median and average are significantly
different, the data is said to be non-normal |
|
Stdev |
|
|
|
Describes
the dispersion spread of data around the average; a measure of “how typical”
the average is |
|
Coffvar |
28.7 |
33.9 |
34.1 |
Ratio
of the standard deviation divided by the average expressed as a percent; larger
values indicate more variation and in this example can be interpreted as
rougher terrain. |
|
Deviation |
-31.9 |
-25.4 |
-29.3 |
Computes
the average deviation of the individual slope values from the watershed average;
larger values indicate more variation and in this example can be interpreted
as rougher terrain. |
Region-Wide Statistics Table. The region-wide statistics suggest that the Target Rock watershed is slightly steeper (Average= 32.9) and not as rough (Coffvar= 28.7) as the other two watersheds.
Summary.
Region-wide summary uses one map (termed the “template” map) to identify
locations whose corresponding values on another map (termed the “data” map)
will be summarized. In this example,
slope values (data map) within three watersheds (template map) were
summarized. A forest manager could use
the same technique to summarize the average slope of individual forest
parcels—the steeper ones being more expensive to harvest. Combine average slope information with
average distance to existing roads and average visual exposure to roads and
houses and the manager has even more information for decision-making. Change the nature of the input data and the
process can be extended to a host of other disciplines—land use planners,
market analysts, environmental scientists, etc.