Applying MapCalc Map Analysis Software
Mapping Surface Flows and Pooling: A farmer needs to identify areas in his
field that are likely to accumulate materials, such as fine soil particles, organic
matter and applied chemicals through surface water flows. The movement of materials to areas of
“pooling” can affect crop production.
<click here> for a
printer friendly version (.pdf)
Base Maps. The Base Maps needed include:
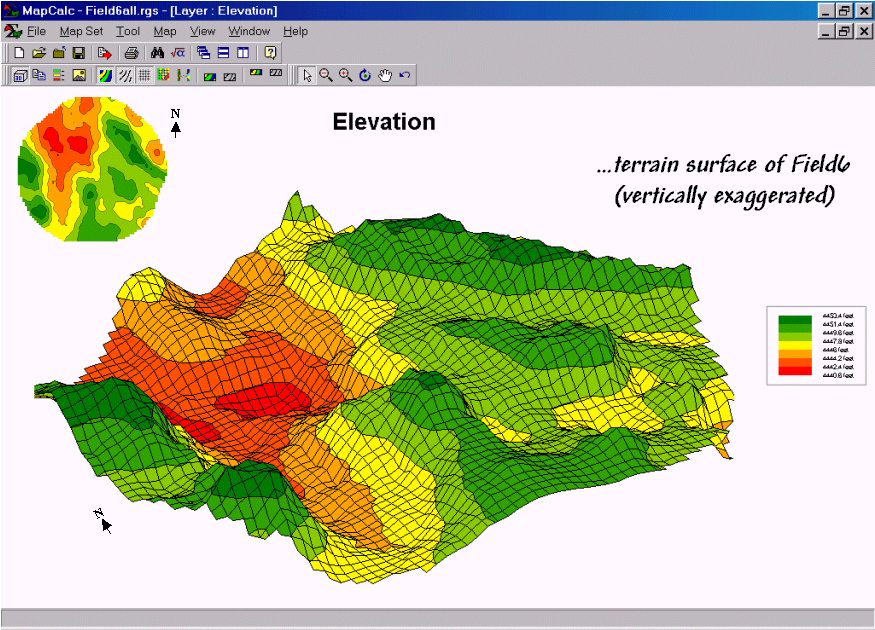 Terrain Surface. This 3D display exaggerates the vertical
relief across the 189 acre, central-pivot field. The effect greatly enhances the twelve-foot
difference for a more effective display of spatial processing and results. Note that the field is highest in the eastern
portion (green tones) and lowest in the
northwestern portion (red tones) of the field.
Terrain Surface. This 3D display exaggerates the vertical
relief across the 189 acre, central-pivot field. The effect greatly enhances the twelve-foot
difference for a more effective display of spatial processing and results. Note that the field is highest in the eastern
portion (green tones) and lowest in the
northwestern portion (red tones) of the field.
Step 1. The MapCalc operation…
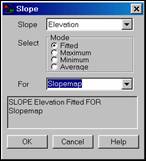 Slope Elevation for Slopemap.
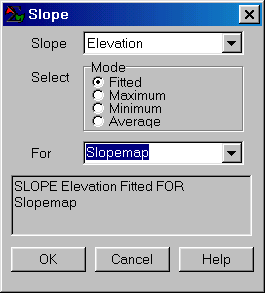
…creates a map of surface inclination by calculating a slope value for each grid cell.
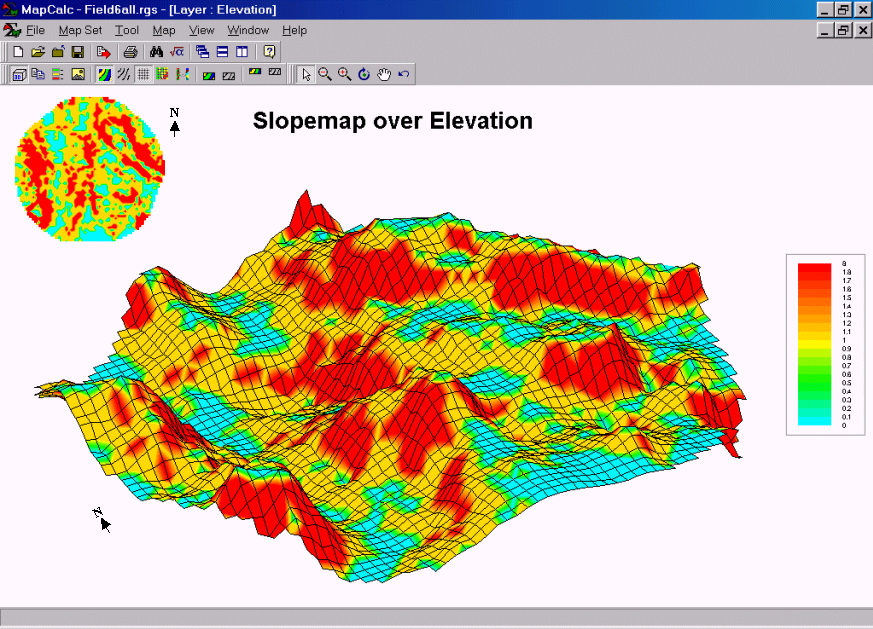 Slopemap
draped over the Elevation Map.
Note the alignment of the steep slopes (red
tones) along the sides of the ridges and that the flat areas (blue tones) align with plateaus and valley
bottoms. Slopes range from 0 to 7
percent with an average slope of about one percent.
Slopemap
draped over the Elevation Map.
Note the alignment of the steep slopes (red
tones) along the sides of the ridges and that the flat areas (blue tones) align with plateaus and valley
bottoms. Slopes range from 0 to 7
percent with an average slope of about one percent.
Step 2. The MapCalc operation…
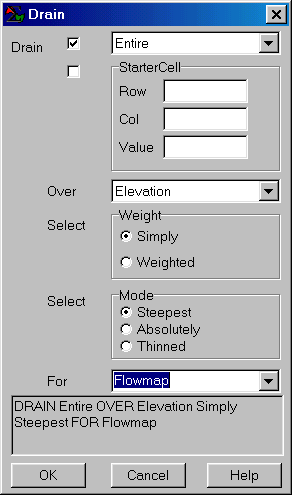 Drain Entire over Elevation for Flowmap.
…creates a map of water confluence. The procedure simulates a rain burst over the entire field then tracks the amount of water that passes through each grid cell.
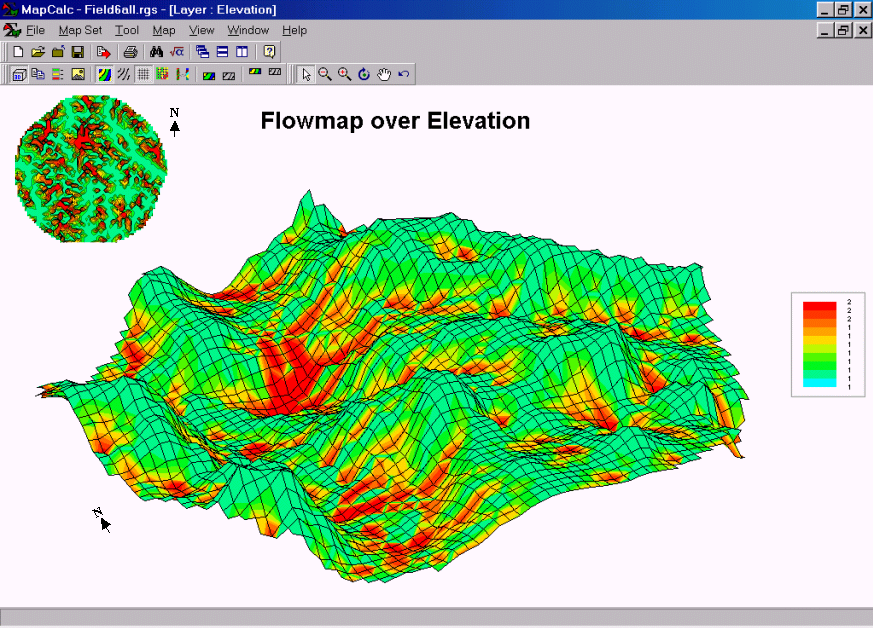 Flowmap draped over
the Elevation Map. The areas of
high water flow are shown in red tones. These locations have numerous uphill grid
cells that pass water to them. If an
area of heavy water flow occurs on steep slopes, material transport is high
(erosion). If heavy flow occurs on flat
slopes (pooling), deposition of materials occur.
Flowmap draped over
the Elevation Map. The areas of
high water flow are shown in red tones. These locations have numerous uphill grid
cells that pass water to them. If an
area of heavy water flow occurs on steep slopes, material transport is high
(erosion). If heavy flow occurs on flat
slopes (pooling), deposition of materials occur.
Step 3. The MapCalc operations…
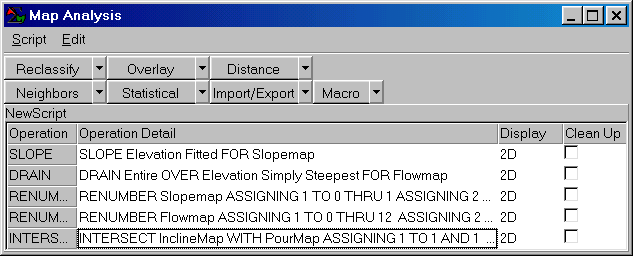 Pooling Macro Script. The Slopemap and Flowmap described above are “Renumbered” to identify
locations that are Flat (1) or Steep (2) slopes and
Light (1) or Heavy (2) flows. The
“Intersect” operation is used to combine the slope and flow classes…
Pooling Macro Script. The Slopemap and Flowmap described above are “Renumbered” to identify
locations that are Flat (1) or Steep (2) slopes and
Light (1) or Heavy (2) flows. The
“Intersect” operation is used to combine the slope and flow classes…
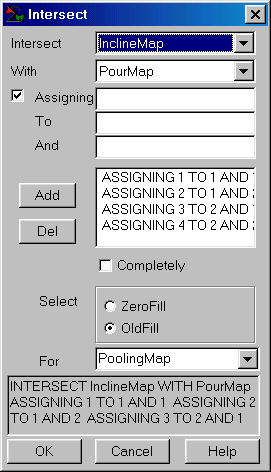 Intersect InclineMap
with PourMap assigning 1 to 1 and 1 assigning 2 to 1
and 2 assigning
Intersect InclineMap
with PourMap assigning 1 to 1 and 1 assigning 2 to 1
and 2 assigning
…creates a map that locates areas with Flat slopes and Light flows (1,1), Flat/Heavy (1,2), Steep/Light (2,1) and Steep/Heavy.
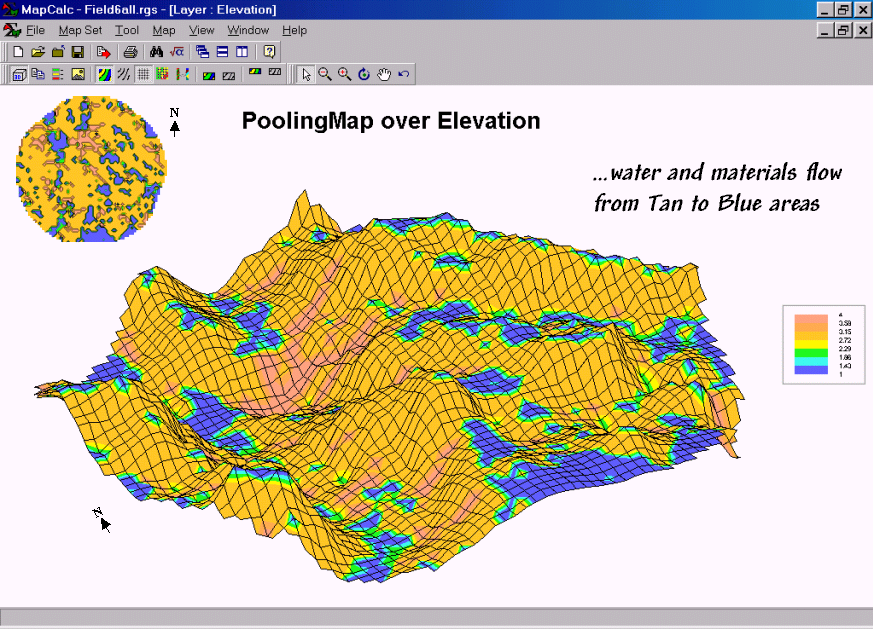
Poolingmap draped over the Elevation Map. The Blue tone areas (Flat slope and Heavy flows) indicate pooling and infiltration that tends to accumulate fine soil particles, organic materials and applied chemicals. The Tan toned areas (Steep slopes and Heavy flows) indicate locations that tend to lose materials through surface flows. Note the linear form of the areas with the highest erosion potential. On larger areas exhibiting more relief these areas will form distinct channels.
Summary. Micro terrain features in an agricultural
field play a major role in crop production. Terrain analysis helps farmers tailor
management actions, such as field-leveling and drainage tiles. In addition, the procedures can help explain
the spatial distribution of soil nutrients and assist in the development of
site-specific fertilization prescriptions for variable rate application of
chemicals.