MapCalc
Interface and Display (design statement 7/00)
The MapCalc system
contains many capabilities that are not available in most desktop
<click
here> for a printer friendly
version (.pdf)
![]() User Interface and Macro
Builder
User Interface and Macro
Builder
![]() Spatial Statistics and
Analysis Operations
Spatial Statistics and
Analysis Operations
___________________________________________________________
![]() Import/Export and Database Management…
Import/Export and Database Management…
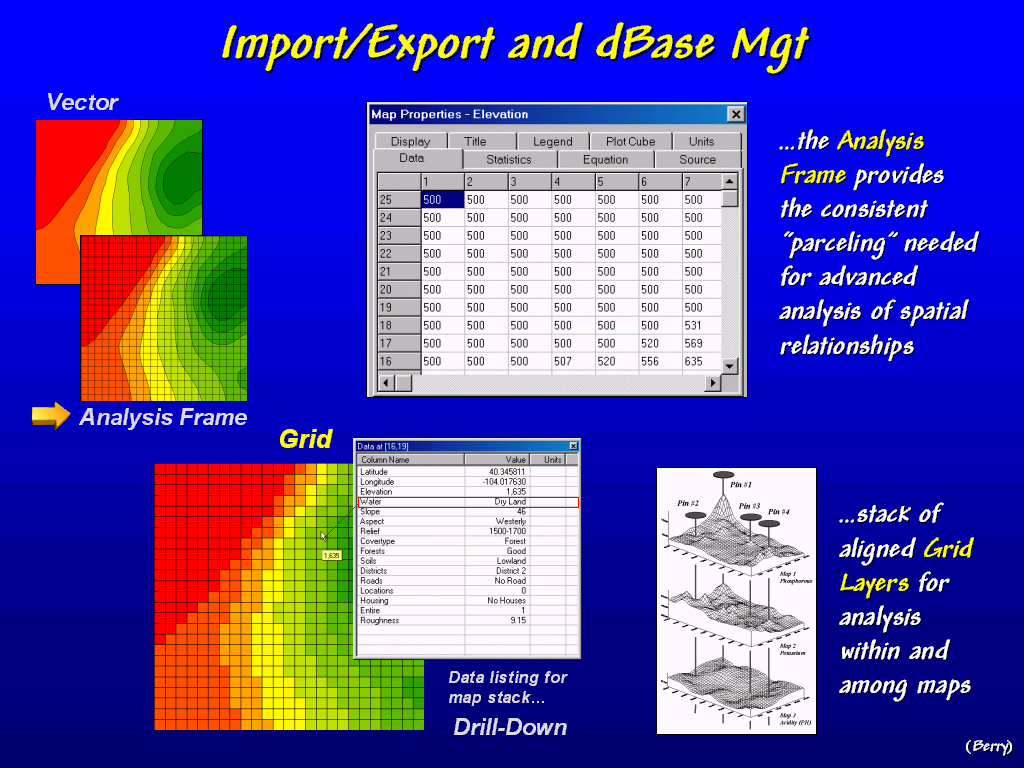 Import/Export and Database Management. Traditional
vector maps contain irregular polygons (e.g., discrete terrain contours)
that assume the same response everywhere within a polygon. For example, map locations within a 500-700
foot contour polygon cannot be identified by their actual elevation values
within that broad range. An analysis
frame, serves as a “spatial sampling design” that carries a value for each
sample location, termed a grid cell. A grid
map forms a continuous spatial distribution of a map variable, such as an
elevation surface. The consistent grid
reference provides a structure that facilitates advanced analytical
capabilities that cannot be performed using traditional vector maps.
Import/Export and Database Management. Traditional
vector maps contain irregular polygons (e.g., discrete terrain contours)
that assume the same response everywhere within a polygon. For example, map locations within a 500-700
foot contour polygon cannot be identified by their actual elevation values
within that broad range. An analysis
frame, serves as a “spatial sampling design” that carries a value for each
sample location, termed a grid cell. A grid
map forms a continuous spatial distribution of a map variable, such as an
elevation surface. The consistent grid
reference provides a structure that facilitates advanced analytical
capabilities that cannot be performed using traditional vector maps.
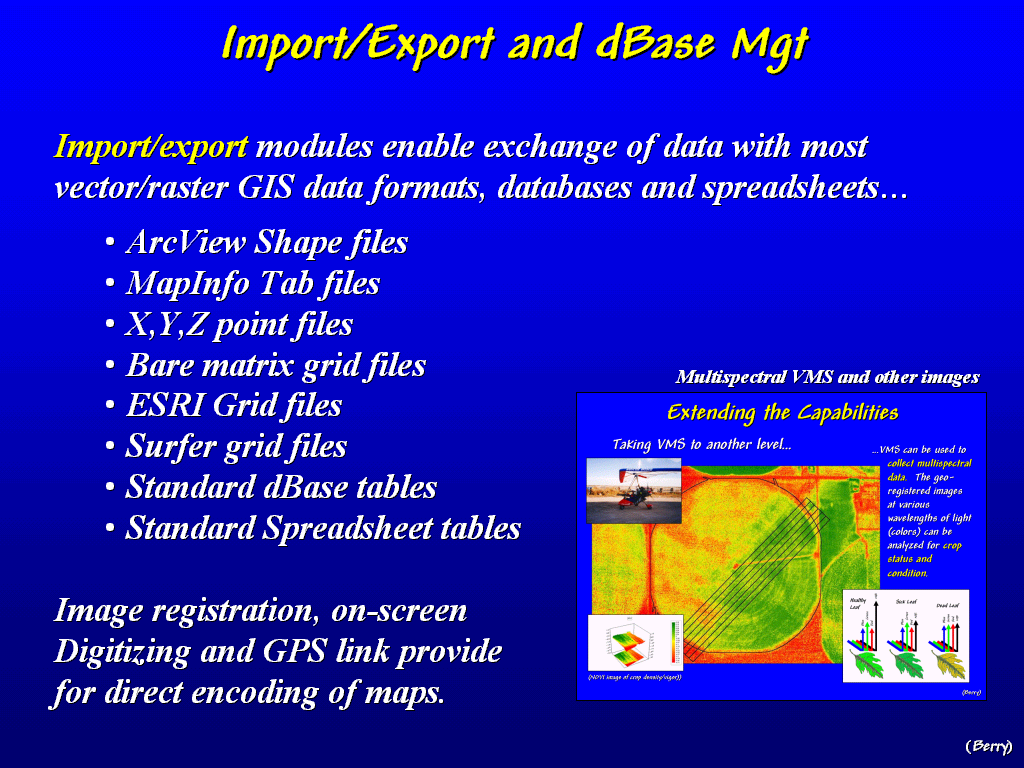 Import/Export
and Database Management. MapCalc
can exchange data in a variety of standard formats and contains tools for
direct encoding of maps. Research into
integrating Red Hen System’s video mapping device (Multimedia Mapper) is
underway. The device can be used to
collect digital multispectral imagery that becomes additional grid layers for
analysis in MapCalc.
Import/Export
and Database Management. MapCalc
can exchange data in a variety of standard formats and contains tools for
direct encoding of maps. Research into
integrating Red Hen System’s video mapping device (Multimedia Mapper) is
underway. The device can be used to
collect digital multispectral imagery that becomes additional grid layers for
analysis in MapCalc.
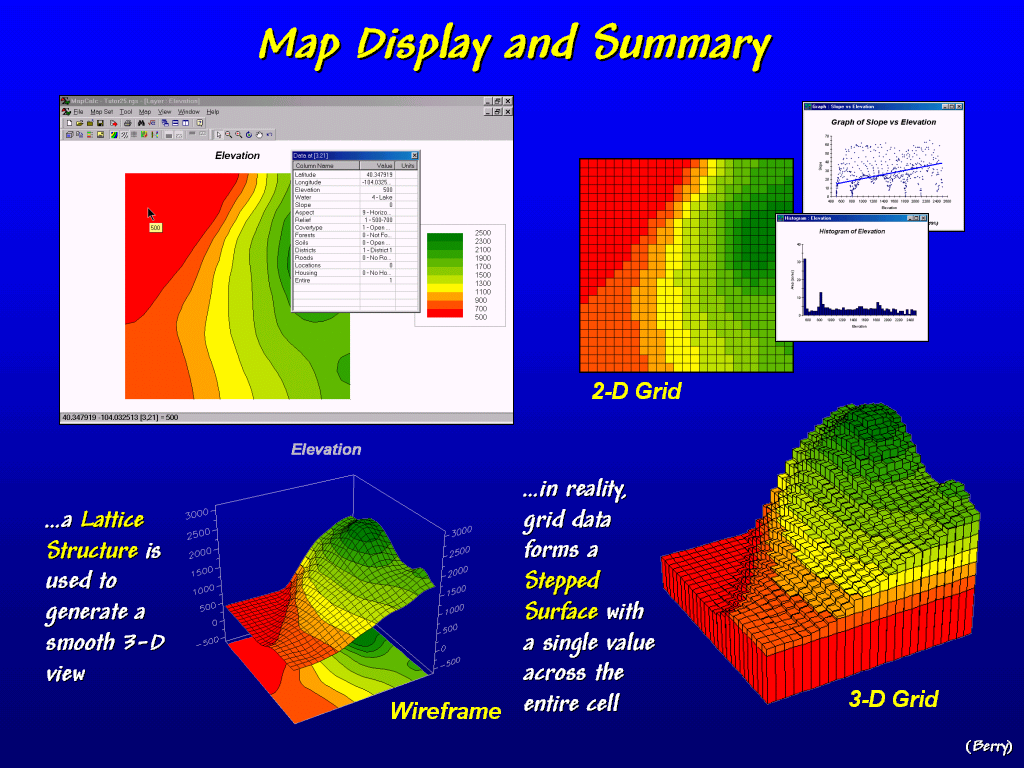 Map Display and Summary. MapCalc provides four types of map display
for grid surfaces…
Map Display and Summary. MapCalc provides four types of map display
for grid surfaces…
ü 2-D Vector – traditional “color-fill contour” maps composed of line segments defining boundaries,
ü 2-D Grid – each grid cell is assigned a color that corresponds to its stored value (interval range),
ü 3-D Vector – commonly referred to as “wireframe maps” that connect lines to the center of each cell raised to the height of its stored value, and
ü 3-D Grid – each grid cell is raised to the height of its stored value (extruded).
Vector displays provide smoothed renderings of map surfaces while grid displays show the actual appearance of the stored data. Summary statistics and charts, such as histograms and scatterplots, are easily generated from grid data.
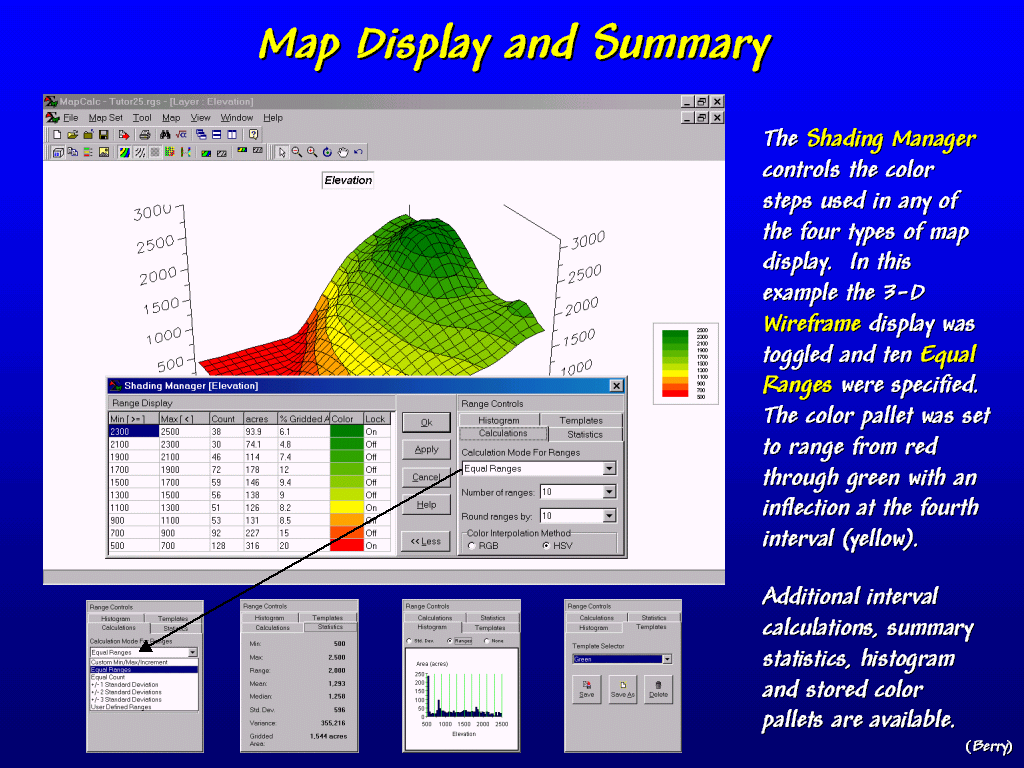 Map Display and Summary. MapCalc’s Shading Manager sets the contour
intervals and color pallet for all four of the display types.
Map Display and Summary. MapCalc’s Shading Manager sets the contour
intervals and color pallet for all four of the display types.
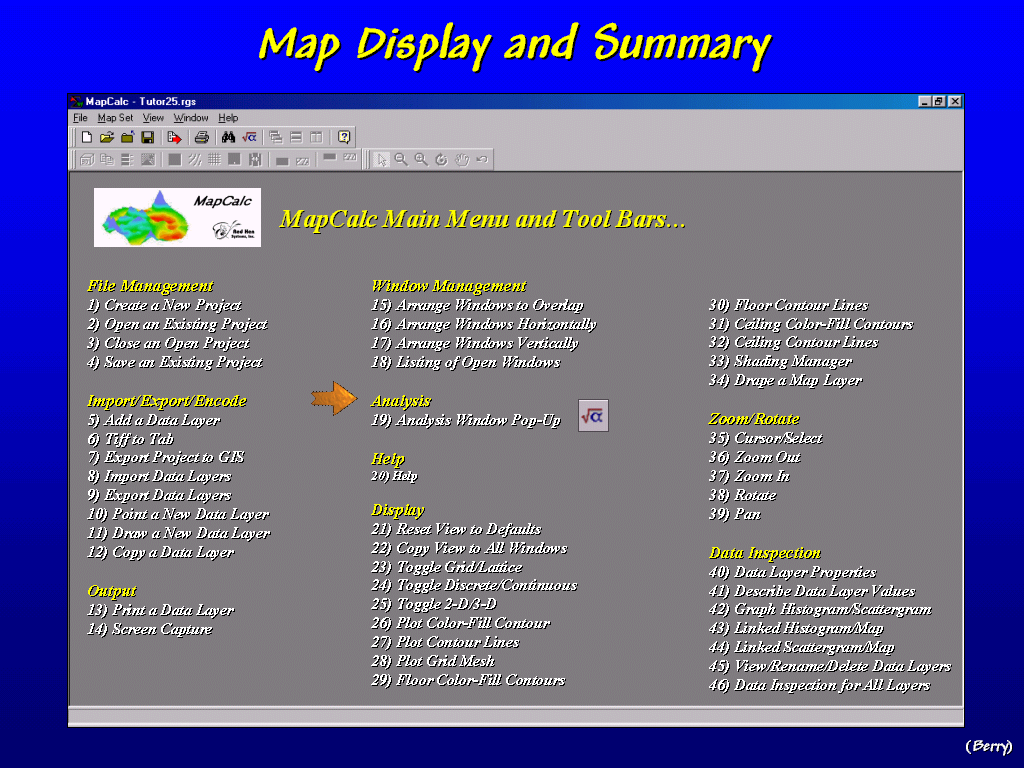 Map Display and Summary. An extensive set of data handling, map
display and summary tools are available… all within a “point-and-click”
interface. Comprehensive “online help”
is available for each operation.
Map Display and Summary. An extensive set of data handling, map
display and summary tools are available… all within a “point-and-click”
interface. Comprehensive “online help”
is available for each operation.
![]() User Interface and Macro Builder…
User Interface and Macro Builder…
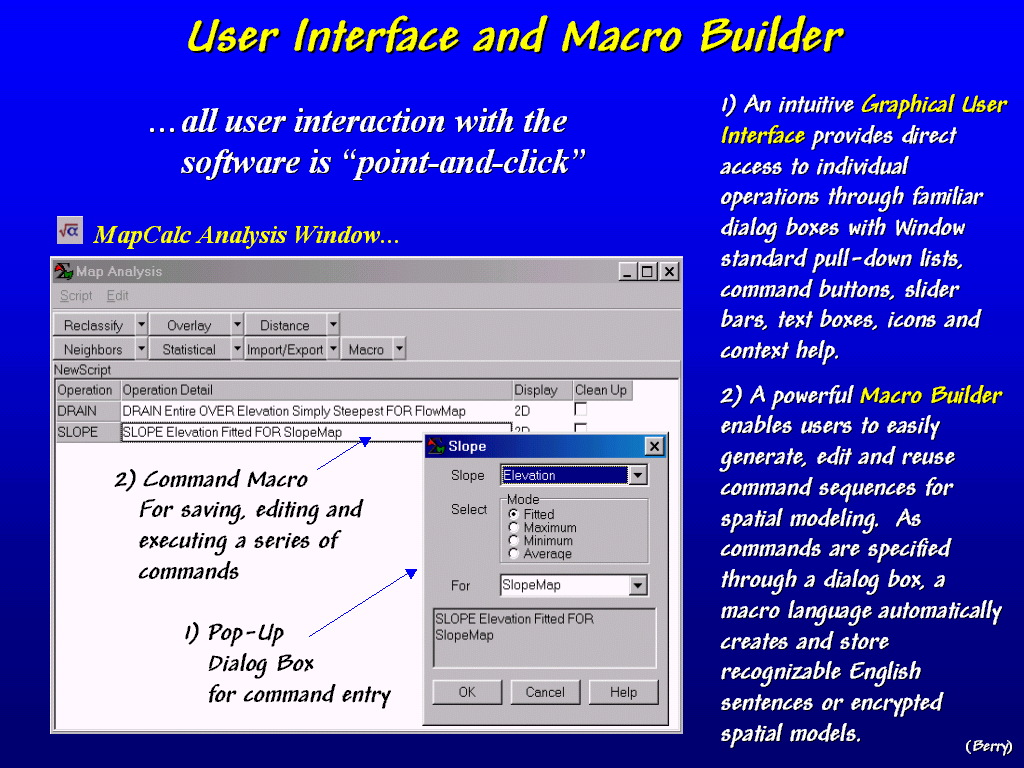 User Interface and Macro Builder. The analytical operations are specified
through interactive Dialog Boxes.
Completed commands are written to a Macro Builder that
provides storage, editing and reuse of command sequences (scripts). The easy to use interface enables the
development of
User Interface and Macro Builder. The analytical operations are specified
through interactive Dialog Boxes.
Completed commands are written to a Macro Builder that
provides storage, editing and reuse of command sequences (scripts). The easy to use interface enables the
development of
![]() Spatial Statistics Operations…
Spatial Statistics Operations…
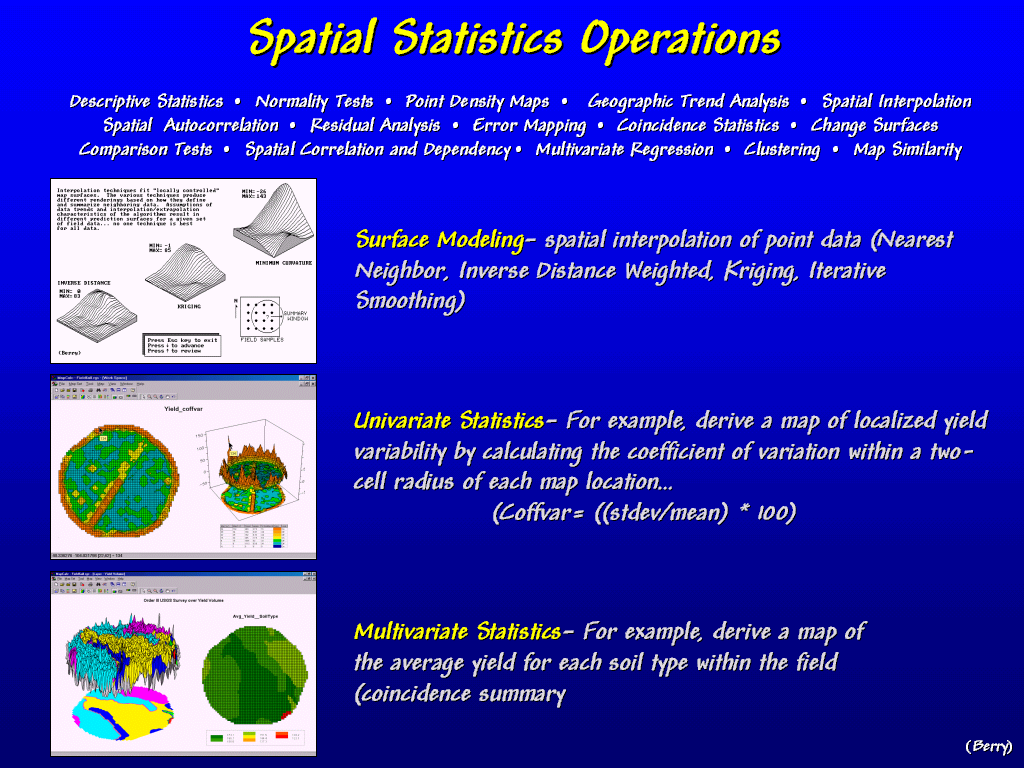 Spatial Statistics Operations. MapCalc analytical operations can be divided
in Spatial Statistics and Spatial Analysis.
Spatial Statistics involves techniques that mathematically
summarize the spatial distribution of data and the relationships among maps…
Spatial Statistics Operations. MapCalc analytical operations can be divided
in Spatial Statistics and Spatial Analysis.
Spatial Statistics involves techniques that mathematically
summarize the spatial distribution of data and the relationships among maps…
ü Surface Modeling – interpolation of point samples for continuous map surfaces
ü Univariate Statistics – summarize patterns within a single map
ü Multivariate Statistics – summarize the coincidence and relationships among two or more maps.
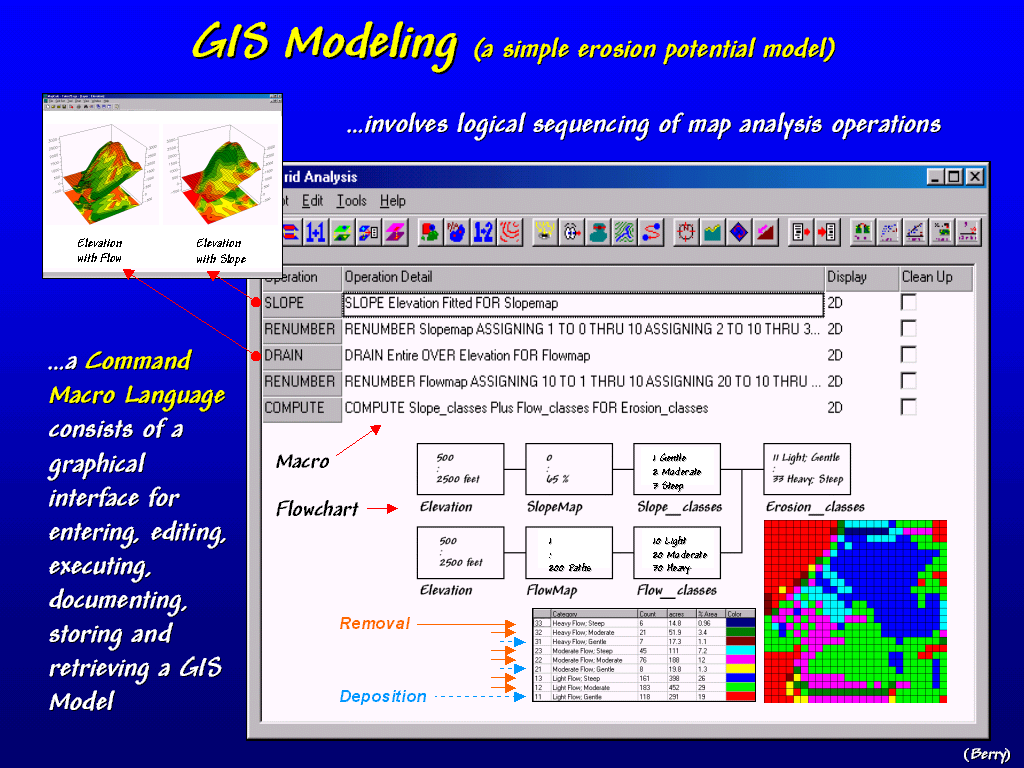
 Spatial Analysis Operations. Operations involving Spatial Analysis
characterize the geographic context of map features, such as distance, optimal
paths, visibility, shape/pattern, and slope/aspect. In this example, terrain analysis is used to
characterize the slope and surface flow for an area.
Spatial Analysis Operations. Operations involving Spatial Analysis
characterize the geographic context of map features, such as distance, optimal
paths, visibility, shape/pattern, and slope/aspect. In this example, terrain analysis is used to
characterize the slope and surface flow for an area.
![]() Powerful Tools for Mapped Data Analysis…
Powerful Tools for Mapped Data Analysis…
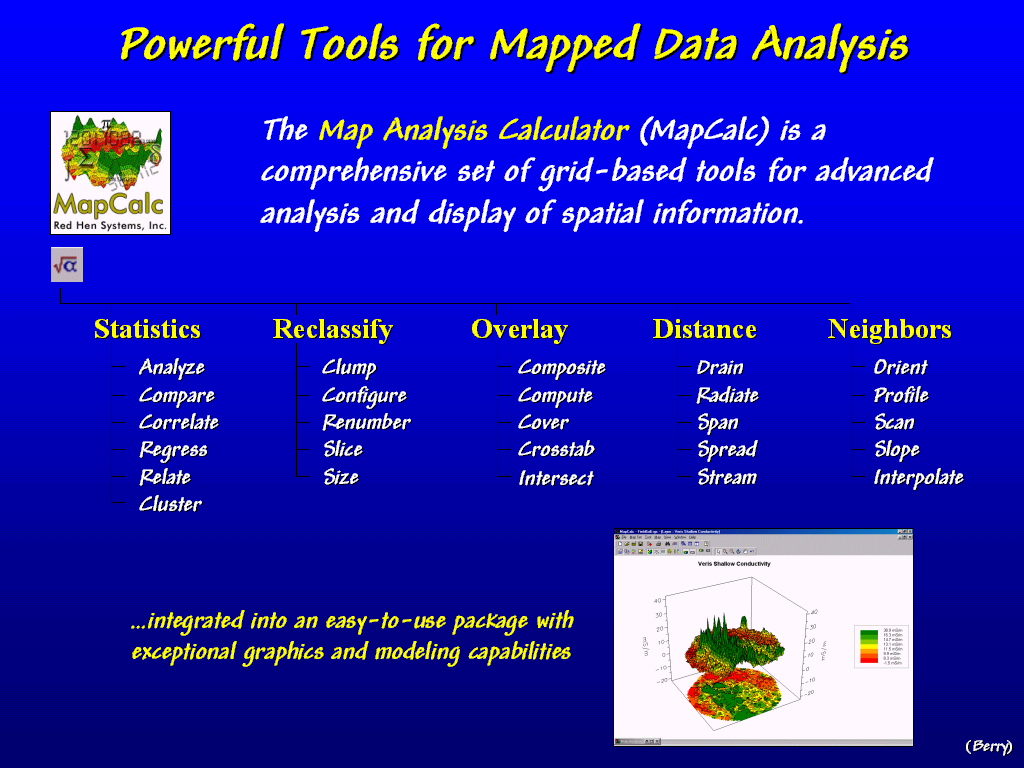 Powerful Tools for Mapped Data
Analysis. MapCalc contains basic
and advanced analytical tools. While
most desktop
Powerful Tools for Mapped Data
Analysis. MapCalc contains basic
and advanced analytical tools. While
most desktop
ü …enhanced
and extended features for existing data handling, analysis and display
capabilities
ü …interactive
links between spatial (maps) and numerical (scattergram) distributions
ü …integrated
project manger and database design
ü …integrated
model flowcharts and command macro builder
ü …enhanced
remote sensing data links and image analysis capabilities
ü …integrated
data mining module