Underlying Concerns and Considerations
in Remote Sensing of Crop Type and Condition
by Joseph K. Berry1 and David K. Wright2
Click <here> to
view the complete online slide set and notes accompanying this topic.

www.agriculture.com …Online articles and active discussion forum on
technology
________________________________
Part 1 – Aerial Remote Sensing Applications in Agriculture
 Remote sensing (RS) of crops promises to
revolutionize the monitoring of crop status and conditions. Recent advances in satellite, aircraft and
proximal data collection, coupled with geographic information systems (GIS)
technology and the Internet provide a wealth of new information sources and
ways of visualizing and analyzing these data.
This two-part @gInnovator Online presentation will
investigate the nature of RS data, crop physiology factors affecting the data,
and considerations in data analysis and interpretation. An ongoing study using a multispectral video
mapping system in monitoring crop nitrogen will serve to illustrate the
important concerns and considerations in remote sensing of agricultural crops.
Remote sensing (RS) of crops promises to
revolutionize the monitoring of crop status and conditions. Recent advances in satellite, aircraft and
proximal data collection, coupled with geographic information systems (GIS)
technology and the Internet provide a wealth of new information sources and
ways of visualizing and analyzing these data.
This two-part @gInnovator Online presentation will
investigate the nature of RS data, crop physiology factors affecting the data,
and considerations in data analysis and interpretation. An ongoing study using a multispectral video
mapping system in monitoring crop nitrogen will serve to illustrate the
important concerns and considerations in remote sensing of agricultural crops.
 GIS
and its closely related field of remote sensing form an alliance that
greatly enhances the technical toolkit for mapping. Remote sensing is actually
GIS's older brother, having its modern roots in World War II. Camouflage
detection film was used to distinguish between healthy vegetation and cut
branches piled on top of military equipment. To the human eye and normal film
the healthy and cut branches were both green (at least for a few days), but on
the new film they showed up as two different colors.
GIS
and its closely related field of remote sensing form an alliance that
greatly enhances the technical toolkit for mapping. Remote sensing is actually
GIS's older brother, having its modern roots in World War II. Camouflage
detection film was used to distinguish between healthy vegetation and cut
branches piled on top of military equipment. To the human eye and normal film
the healthy and cut branches were both green (at least for a few days), but on
the new film they showed up as two different colors.
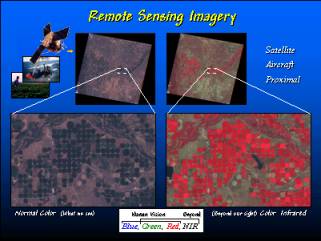
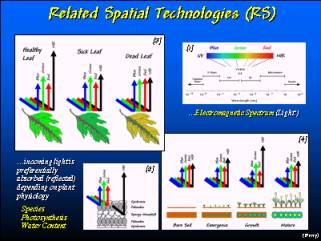 Remote sensing uses relative variations in electromagnetic radiation
(EMR) to identify landscape characteristics and conditions. In fact, so do your
eyes. Sunlight (the "visible" form of EMR) starts off with fairly
equal parts of blue, green and red light. When sunlight interacts with an
object, the object’s composition causes it to absorb varying amounts of the
different wavelengths of EMR "light." What light isn’t absorbed is
reflected to your eyes. Your brain interprets the subtle differences in the
amount of blue, green and red in the reflected light to recognize the thousands
of colors we relate to our surroundings.
Remote sensing uses relative variations in electromagnetic radiation
(EMR) to identify landscape characteristics and conditions. In fact, so do your
eyes. Sunlight (the "visible" form of EMR) starts off with fairly
equal parts of blue, green and red light. When sunlight interacts with an
object, the object’s composition causes it to absorb varying amounts of the
different wavelengths of EMR "light." What light isn’t absorbed is
reflected to your eyes. Your brain interprets the subtle differences in the
amount of blue, green and red in the reflected light to recognize the thousands
of colors we relate to our surroundings.
 There are three levels of acquiring
remote sensing images—satellite, aerial and proximal. Each has advantages and disadvantages including cost,
availability and information content.
There are three levels of acquiring
remote sensing images—satellite, aerial and proximal. Each has advantages and disadvantages including cost,
availability and information content.
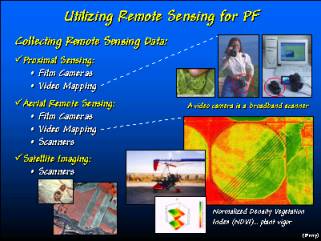
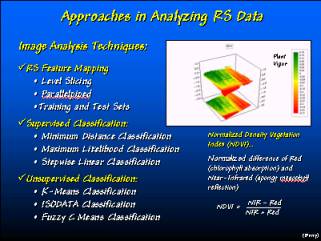 There are several techniques for computer
enhancement and analysis of remote sensing data. The Normalized Density Vegetation Index (NDVI) is a widely
used approach for extracting information on crops.
There are several techniques for computer
enhancement and analysis of remote sensing data. The Normalized Density Vegetation Index (NDVI) is a widely
used approach for extracting information on crops.
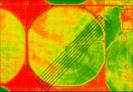
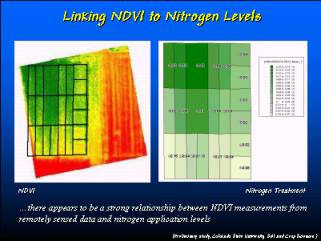 The map on the left is a NVDI image of
nitrogen plots with the treatments shown in the map on the right. Note the corresponding patterns.
The map on the left is a NVDI image of
nitrogen plots with the treatments shown in the map on the right. Note the corresponding patterns.
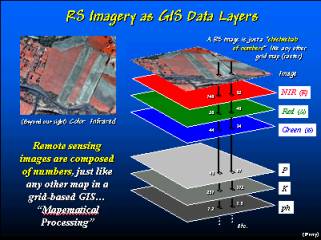 Within a GIS, remote sensing data becomes
additional layers of information. The
Blue, Green, Red and Near Infrared data can be analyzed for relationships
linking crop type and condition to specific patterns of numbers on the maps.
Within a GIS, remote sensing data becomes
additional layers of information. The
Blue, Green, Red and Near Infrared data can be analyzed for relationships
linking crop type and condition to specific patterns of numbers on the maps.
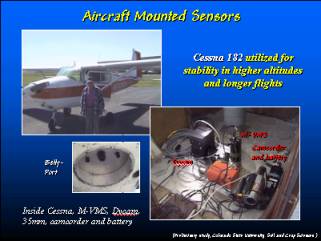 Airborne cameras have been used since the
1950’s. More recently, video and
digital cameras have been tried because their low cost and digital nature of
the data.
Airborne cameras have been used since the
1950’s. More recently, video and
digital cameras have been tried because their low cost and digital nature of
the data.
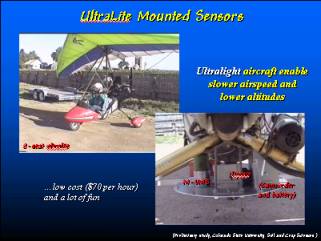 An alternative platform uses an ultralite
(hang glider with an engine) that allows much slower airspeeds, lower altitudes
and minimal costs.
An alternative platform uses an ultralite
(hang glider with an engine) that allows much slower airspeeds, lower altitudes
and minimal costs.
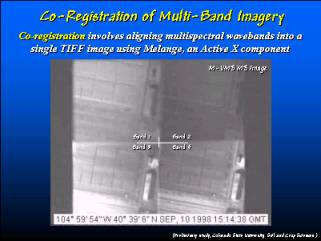 This is a multispectral composite image
(four wavelength bands). Note the
different levels of brightness that correspond to different amounts of
reflected energy.
This is a multispectral composite image
(four wavelength bands). Note the
different levels of brightness that correspond to different amounts of
reflected energy.
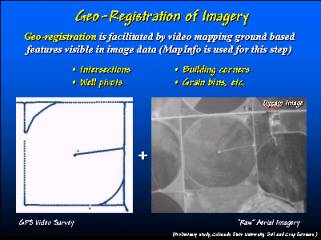 Geo-registration of aerial imagery is
critical. The first step is to capture
GPS coordinates for several readily identifiable features in the image.
Geo-registration of aerial imagery is
critical. The first step is to capture
GPS coordinates for several readily identifiable features in the image.
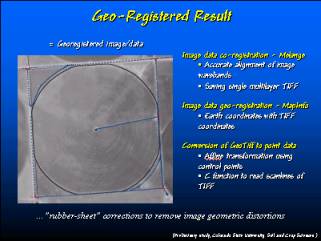 The second step in geo-registration uses a
computer program to adjust the image (termed “rubbersheet”) to fit the
coordinates.
The second step in geo-registration uses a
computer program to adjust the image (termed “rubbersheet”) to fit the
coordinates.
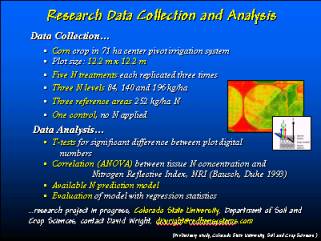 A comprehensive research project relating
nitrogen treatments to remote sensing data is being conducted by Colorado State
University.
A comprehensive research project relating
nitrogen treatments to remote sensing data is being conducted by Colorado State
University.
__________________
These @gInnovator Online materials are based on an invited presentation for the Agriculture Discipline Forum, MidAmerica GIS Symposium on “Strengthening theGrowing Geodata Community,” Osage Beach, Missouri, May 14-18, 2000.
Underlying Concerns and Considerations in Remote Sensing of Crop Type and Condition
1Joseph K. Berry, Columnist for @gInnovator Newsletter, Meredith Publishing
President,
Berry and Associates // Spatial Information Systems
2000
South College Avenue, Suite 300, Fort Collins, CO 80525
![]()
 Phone: 970-215-0825 Email: jberry@innovativegis.com
Website: www.innovativegis.com/basis
2David K. Wright, Graduate Student
Department of Soil and Crop Sciences, Colorado State
University
Research and Development, Red Hen Systems, Inc. Fort
Collins, CO 80525
Abstract
Remote sensing (RS) of crops promises to revolutionize the monitoring of crop status and conditions. Recent advances in satellite, aircraft and proximal data collection, coupled with geographic information systems (GIS) technology and the Internet provide a wealth of new information sources and ways of visualizing and analyzing these data. This presentation will investigate the nature of RS data, crop physiology factors affecting the data, and considerations in data analysis and interpretation. An ongoing study using a multispectral video mapping system in monitoring crop nitrogen will serve to illustrate the important concerns and considerations in remote sensing of agricultural crops.
___________________