What's New in Grapher™ 3?
Grapher is versatile! Grapher 3 runs on Windows 95/98/2000/NT 4.0 and Me. Grapher 3 supports multiple sheet Excel files! Grapher is User Friendly! Toolbars are floating or dockable. Customize your toolbars to include only the buttons you need. Turn toolbars on and off to suit your preference. Create graphs in many different ways.
Turn objects on or off or select objects using the new Object Manager. Grapher Supports Numerous Formats! Many new import and export formats have been added.
Automate Repetitive Tasks! Automate repetitive graphing tasks with Grapher's updated scripting language. Grapher's Scripter™ uses a BASIC syntax and can be called from other OLE compliant applications including Visual BASIC for Applications (VBA). The updated automation language makes it easier than ever to control the properties of individual drawing and graph objects. Grapher is Complete! For professional quality graphs, add headers and footers directly in Grapher. Control exactly what you want to print by turning objects on or off. Add text blocks with colored backgrounds and your professional quality graph is complete and ready for publication! Templates Make the Graph Faster! Use Template Graphs to set graphing preferences in Grapher. Once a template graph is created, use the template with any data set. When opening a template, choose whether to use the same worksheet for each curve or different worksheets. Decide whether to specify the columns for each curve or to use those set by the template. Templates can be used to retain customizations such as the number of decimal places on axis tick mark labels, label angles, axis labels, graph titles, line plot colors, or any other graphing option. Print multiple data files from a template with a single command. Move Plot Labels Sometimes, after creating the plot and adding labels labels overlap. In Grapher, moving these labels is easy. Select the plot and move the labels wherever you want them to be. Labels can be moved up, down, or to the left or right as far as you desire.
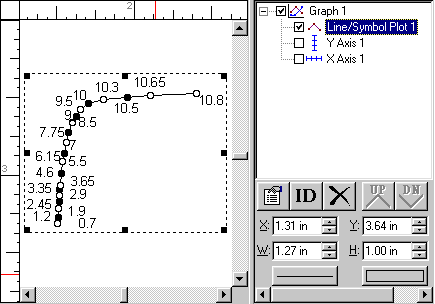
Easily Display and Organize Graph Objects The new object manager graphically displays the organization of all objects and plots held within the plot document. The ability to have the object manager always available makes the editing of objects within a graph much easier. Simply select the object in the object manager and proceed to the dialog box that controls the attributes for that feature. Move objects to the foreground or background by re-arranging the drawing order. Hide objects in the graph by removing the visibility check mark. Change the size, position, line style, fill style, and ID for axes, lines, or any object in your graph.
Use the Object Manager to
view and Create 6 New Graph Types! Six new graph types have been added to Grapher. Create step plots, bubble plots, floating bar charts, rose diagrams, ternary diagrams, and box and whisker plots. In addition, all of the older graph types are still included: line, symbol, function, bar, polar, pie, histograms, and hi-low-close graphs. Display your line plot with only vertical and horizontal lines using Grapher's step plot graph.
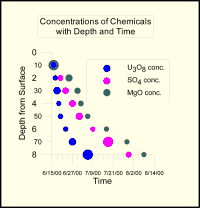
Display your symbol plots as bubble plots to vary the diameter of each bubble based on a third variable. This provides a way to represent an additional dimension of data, effectively making the Bubble Plot a three dimensional graph.
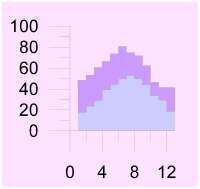
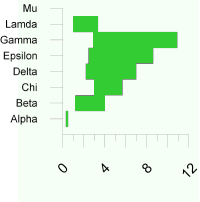
Use Grapher's Floating Bar Charts to display the difference between two variables with respect to the same X variable. Change the bar fill and line properties, add labels, or clip bars. Choose to display bars horizontally or vertically.
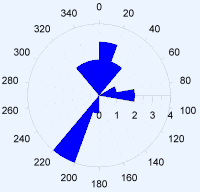
Use Grapher's Rose Diagrams to display statistical data on a polar plot. Change the bin size, change the line or fill color or style, make the bins unidirectional or bidirectional, and add error bars.
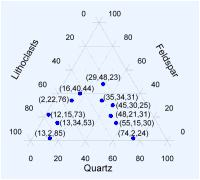
Ternary diagrams show the relative proportions of three variables on three different axes. Set the axis properties to show percentages or fractions. Add grid lines and plot labels to make the graph easier to read.
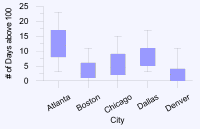
Box-Whisker Plots show statistical information based on a column of data. Show the minimum, maximum, and median data values. Add points to display the outliers.
More Worksheet Features!
Additional Features
Learn more about Golden
Software Products on this CD! Please visit the Golden
Software web site at While visiting the web site,
you'll be able to Copyright 2002, Golden Software, Inc. |

